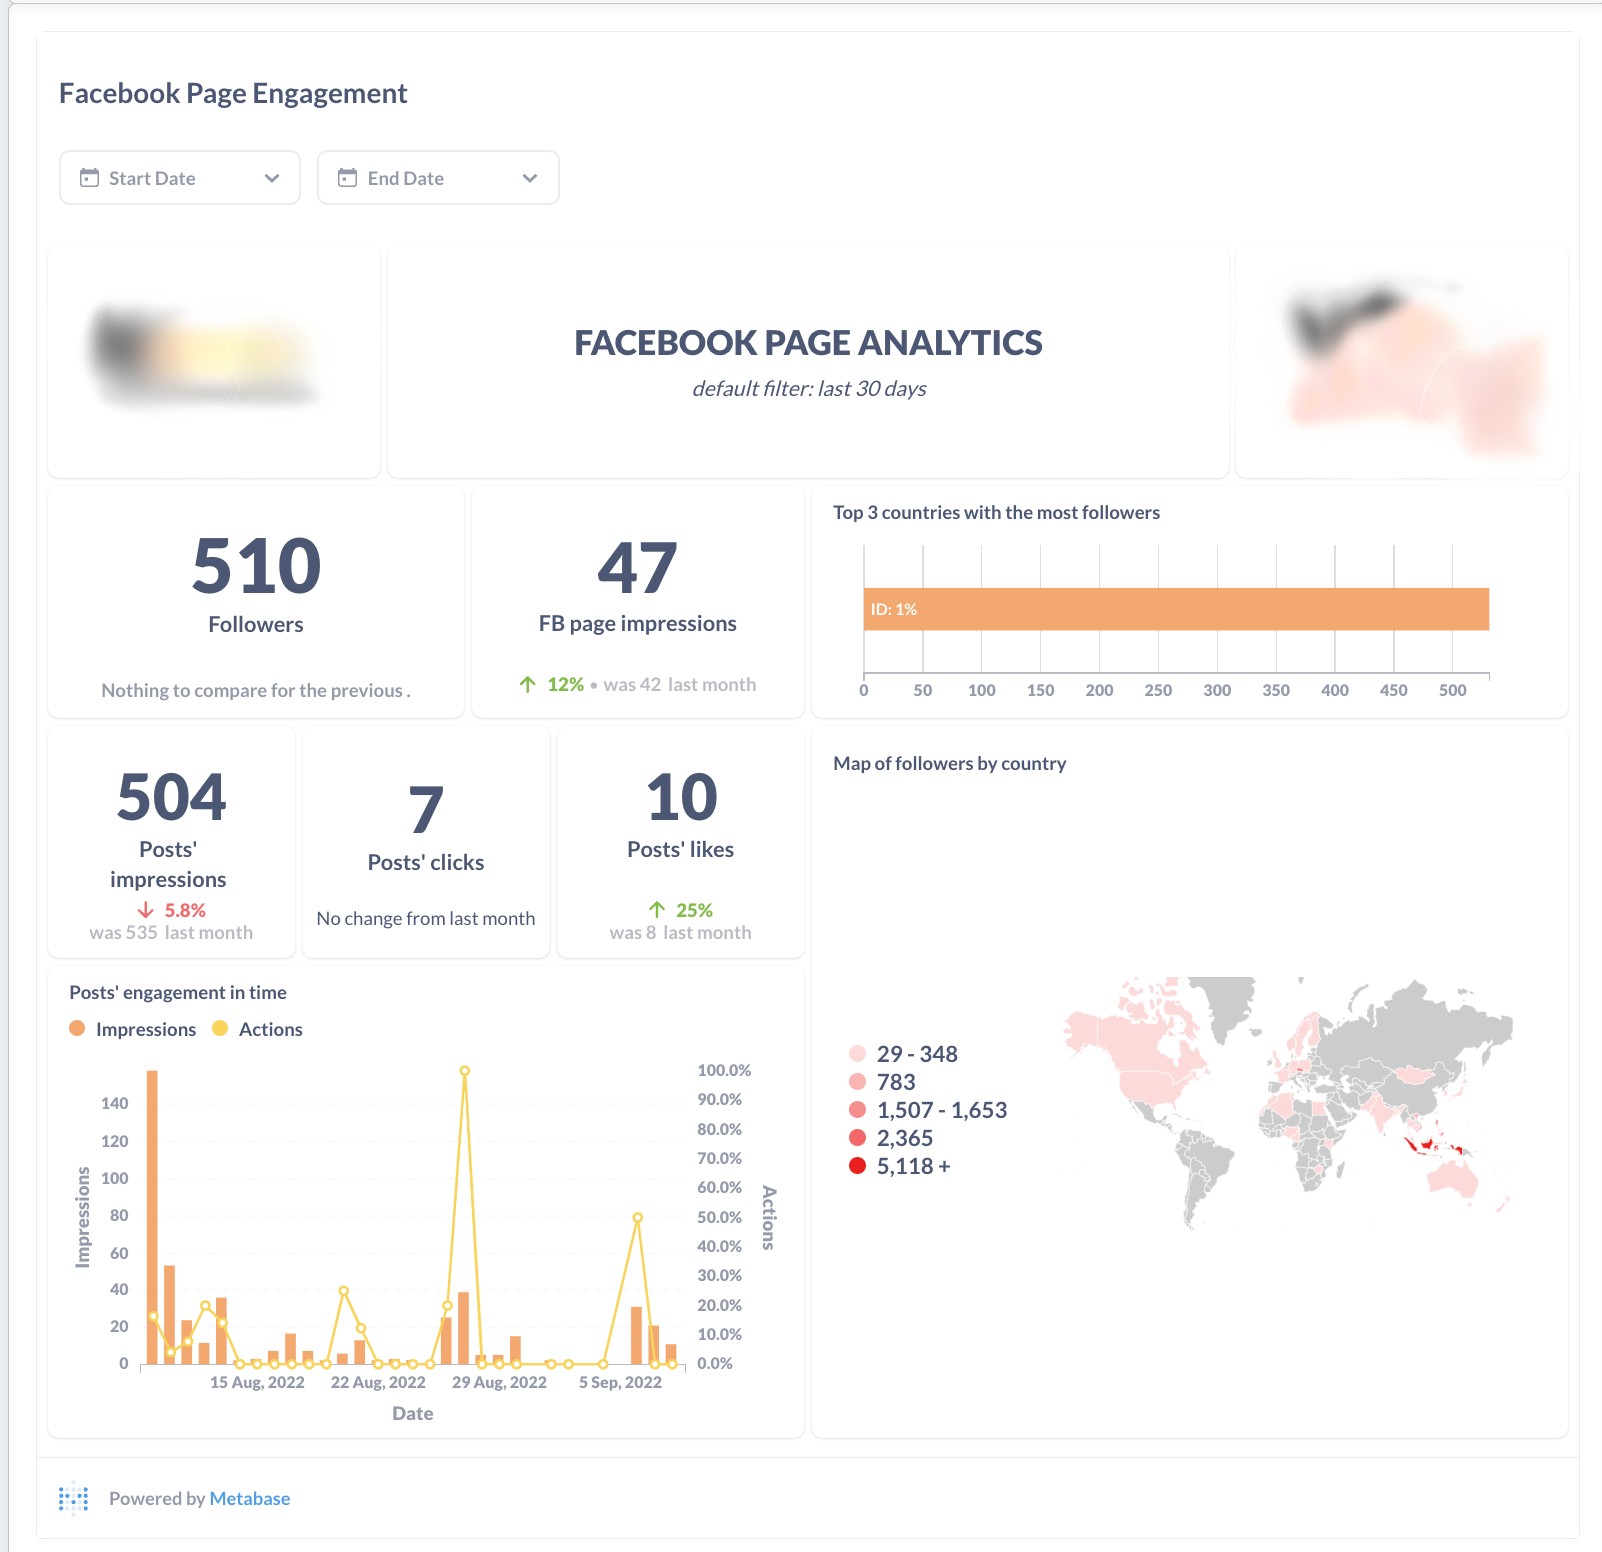
Reporting dashboard example: Facebook page analytics
|
Followers |
It shows the total number of followers. Filterable by start date and end date. Choose week or month and compare: set week with the previous one, or set month with the previous one. |
|
FB page impressions |
It shows the total number of FB page impressions. Filterable by start date and end date. Choose week or month and compare: set week with the previous one, or set month with the previous one. |
|
Posts' impressions |
It shows the total number of posts' impressions. Filterable by start date and end date. Choose week or month and compare: set week with the previous one, or set month with the previous one |
|
Posts' clicks |
It shows the total number of posts' clicks. Filterable by start date and end date. Choose week or month and compare: set week with the previous one, or set month with the previous one. |
|
Posts' likes |
It shows the total number of posts' likes. Filterable by start date and end date. Choose week or month and compare: set week with the previous one, or set month with the previous one. |
|
Top 3 countries with the most followers |
It shows countries with the most followers and a percentage of all followers for each. The percentage is calculated as the number of followers from the country divided by followers in the selected time. Filterable by the end date. |
|
Map of followers by country |
It shows the number of followers in each country. Filterable by the end date. |
|
Posts' engagement in time |
It shows a bar chart of impressions and actions by time. The actions are calculated as engagement divided by unique impressions. Filterable by start date and end date. |
No Comments