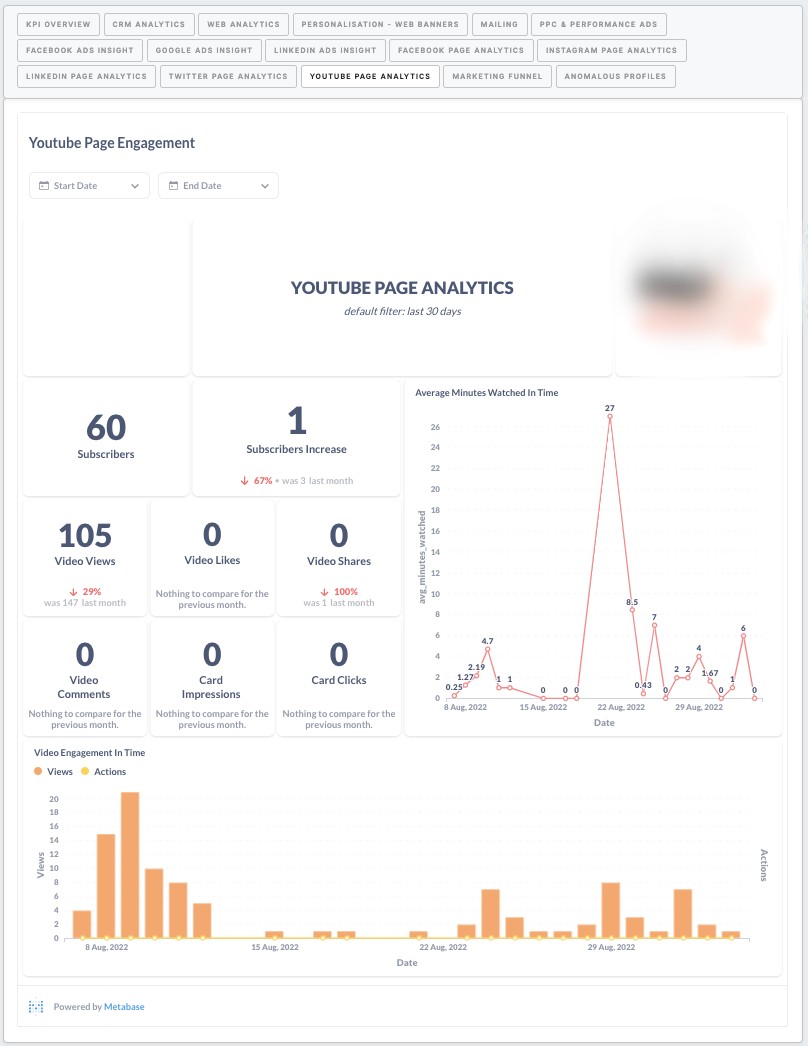
Reporting dashboard example: Youtube page analytics
|
Subscribers |
The total number of subscribers. The number of subscribers: the sum of subscribers gained minus the sum of subscribers lost. Filterable by the end date, the default filter is 30 days. |
|
Subscribers increase |
The number of new subscribers. The increase: the sum of subscribers gained minus the sum of subscribers lost, both in the selected period. Filterable by start date and end date, the default filter is 30 days. Choose week or month and compare: set week with the previous one, or set month with the previous one. |
|
Average minutes watched in time |
It is the line chart of the average of minutes watched per view in time. It is the total of minutes watched divided by views. Filterable by start date and end date, the default filter is 30 days. |
|
Video views |
It is the total number of video views. Filterable by start date and end date, the default filter is 30 days. Choose week or month and compare: set week with the previous one, or set month with the previous one. |
|
Video likes |
It is the total number of video likes. Filterable by start date and end date, the default filter is 30 days. Choose week or month and compare: set week with the previous one, or set month with the previous one. |
|
Video shares |
It is the total number of video shares. Filterable by start date and end date, the default filter is 30 days. Choose week or month and compare: set week with the previous one, or set month with the previous one. |
|
Video comments |
It is the total number of video comments. Filterable by start date and end date, the default filter is 30 days. Choose week or month and compare: set week with the previous one, or set month with the previous one. |
|
Card impressions |
It is the total number of card impressions. Filterable by start date and end date, the default filter is 30 days. Choose week or month and compare: set week with the previous one, or set month with the previous one. |
|
Card clicks |
It is the total number of card clicks. Filterable by start date and end date, the default filter is 30 days. Choose week or month and compare: set week with the previous one, or set month with the previous one. |
|
Video engagement in time |
It is the bar chart of views and actions by time. Actions are likes and shares and comments together, divided by views. Filterable by start date and end date, the default filter is 30 days. |
No Comments