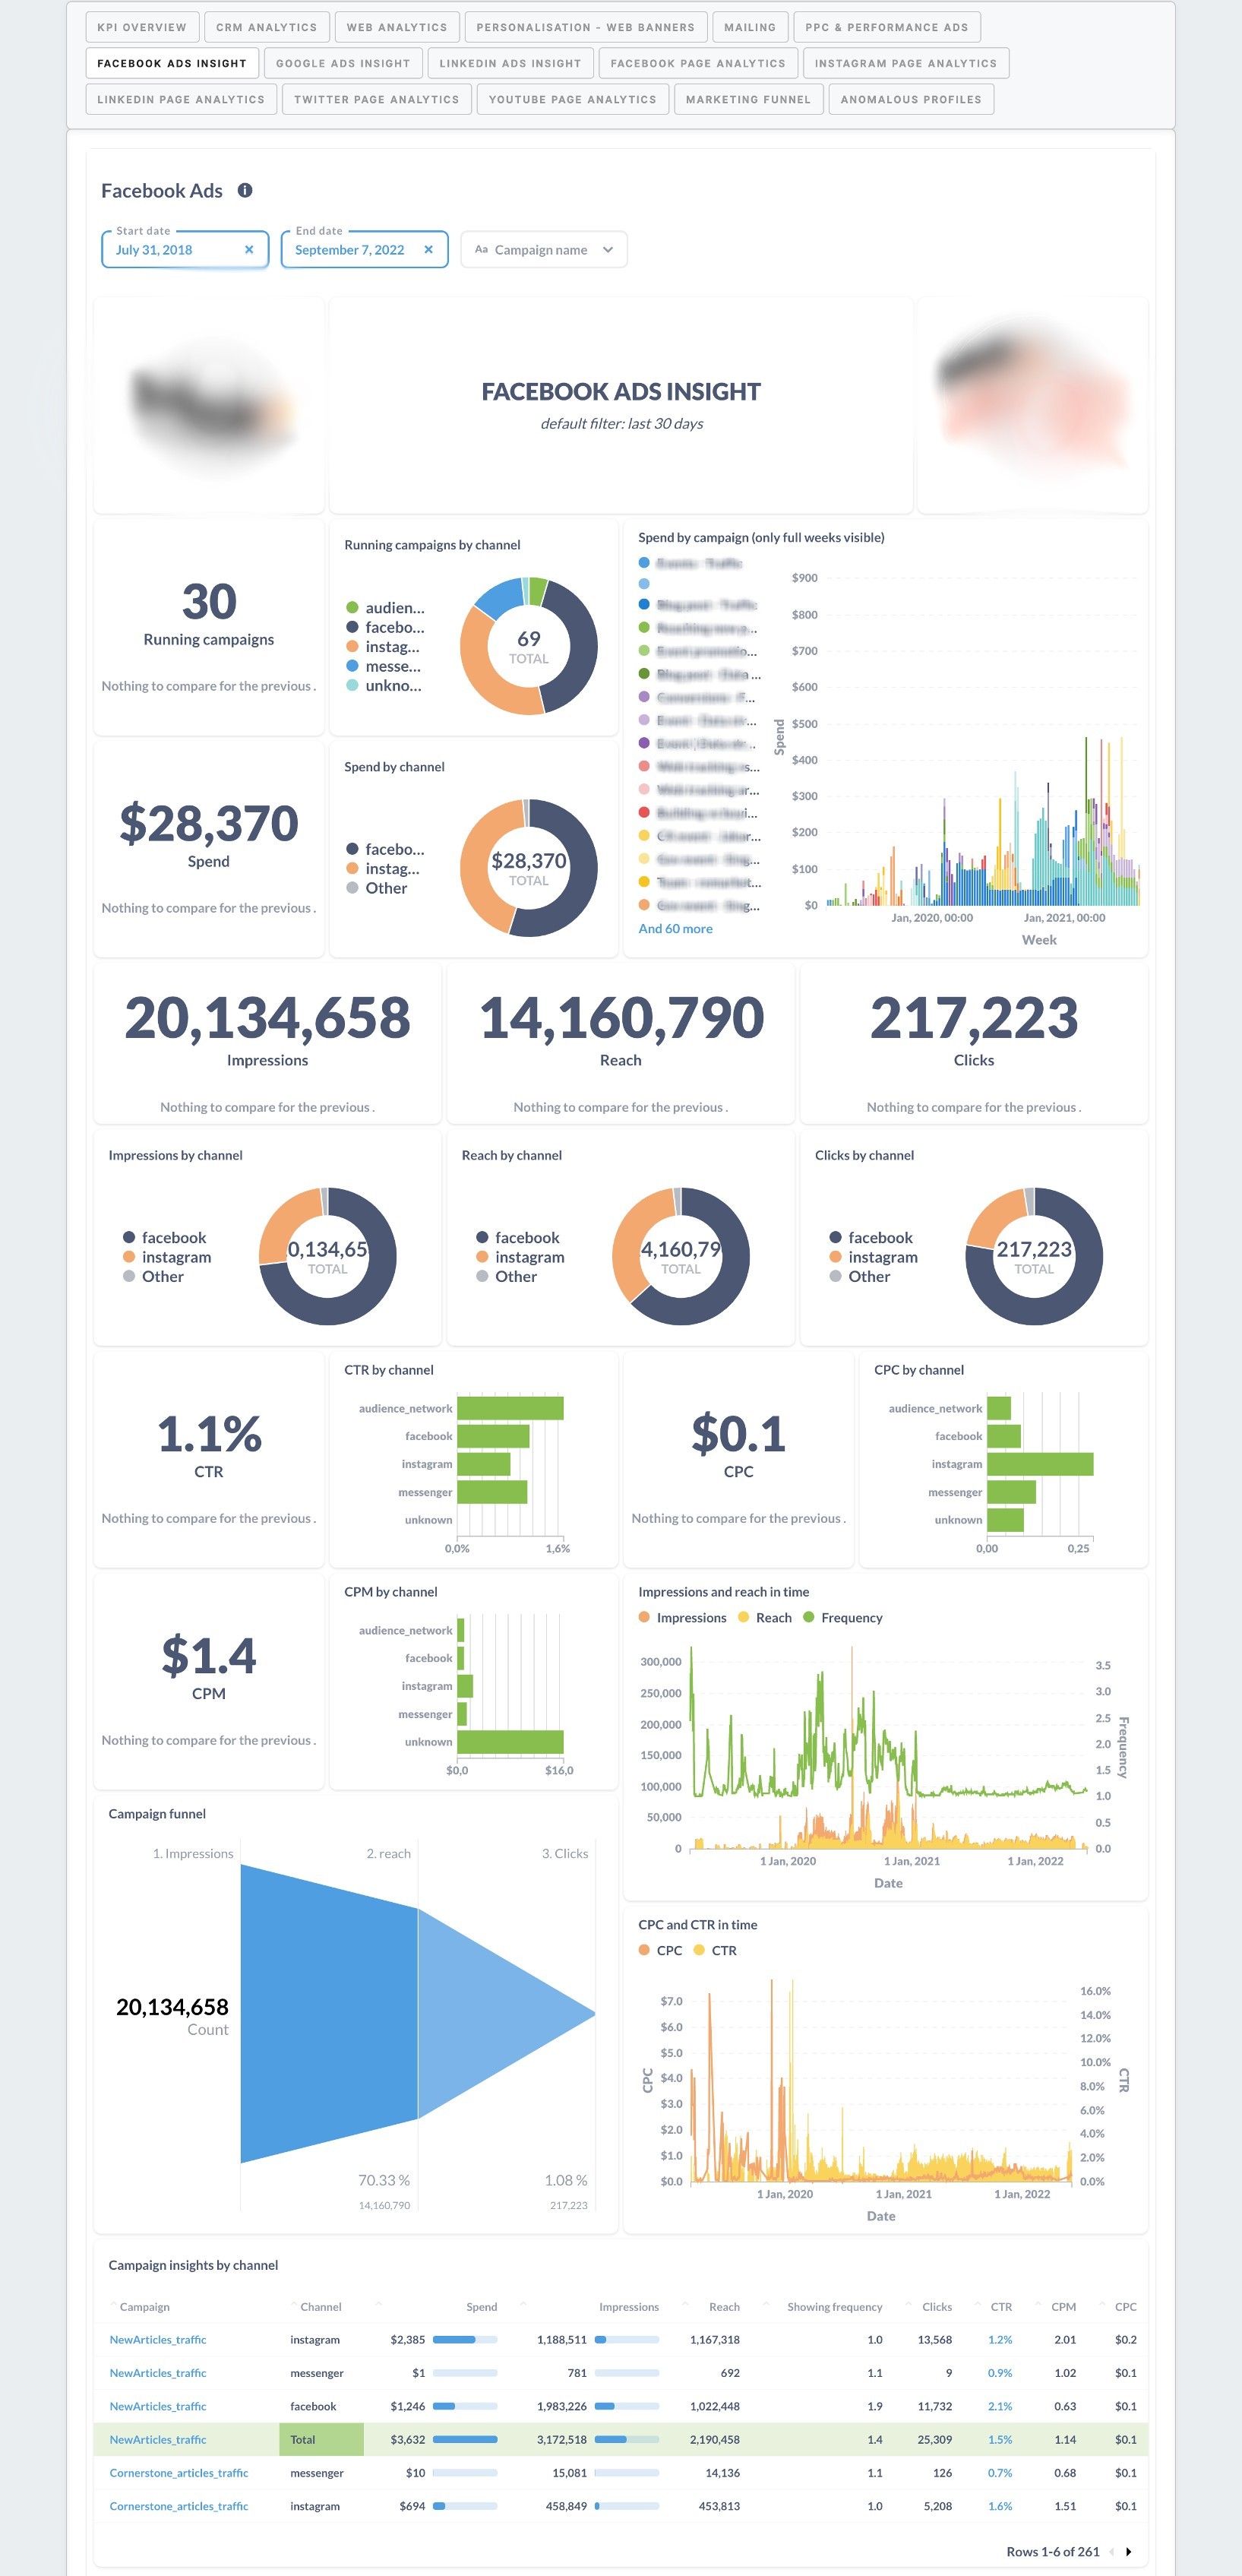
Reporting dashboard example: Facebook Ads insights
|
Running campaigns |
It shows the number of running campaigns. Filterable by start date and end date. Choose week or month and compare: set week with the previous one, or set month with the previous one. |
|
Running campaigns by channel |
It shows the pie chart of the number of running campaigns on each channel. Filterable by the end date. |
|
Spend |
It shows the total spend on campaigns. Filterable by start date, end date, and campaign. Choose week or month and compare: set week with the previous one, or set month with the previous one. |
|
Spend by channel |
It shows the pie chart of spending on campaigns per channel. Filterable by start date, end date, and campaign name. |
|
Spend by campaign (only full weeks visible) |
It shows the bar chart of spending on campaigns by date. Filterable by start date, end date, and campaign name. |
|
Impressions |
It shows the number of impressions. Filterable by start date, end date, and campaign name. Choose week or month and compare: set week with the previous one, or set month with the previous one. |
|
Reach |
It shows the sum of all users reached. Filterable by start date, end date, and campaign name. Choose week or month and compare: set week with the previous one, or set month with the previous one. |
|
Clicks |
It shows the number of clicks. Filterable by start date, end date, and campaign name. Choose week or month and compare: set week with the previous one, or set month with the previous one. |
|
Impressions by channel |
It shows the pie chart of the number of impressions by channel. Filterable by start date, end date, and campaign name. |
|
Reach by channel |
It shows the pie chart of unique users reached by channel. Filterable by start date, end date, and campaign name. |
|
Clicks by channel |
It shows the pie chart of clicks by channel. Filterable by start date, end date, and campaign name. |
|
CTR |
It shows the ratio of users who clicked on ads to those who viewed the ad, calculated as clicks divided by impressions. Filterable by start date, end date, and campaign name. |
|
CTR by channel |
It shows the row chart of the ratio of users who clicked on the ad to those who viewed it, plotted by channel, calculated as clicks divided by impressions. Filterable by start date, end date, and campaign. |
|
CPC |
It shows the ratio of total spends on ads to the users who clicked on ads, calculated as total spending divided by clicks. Filterable by start date, end date, and campaign. |
|
CPC by channel |
It shows the row chart of the total spends on an ad to the users who clicked on an ad, plotted by channel, calculated as total spend divided by clicks. Filterable by start date, end date, and campaign. |
|
CPM |
It shows the cost of a thousand impressions of the ad. Calculated as spending divided by impressions, and it is shown in thousands. Filterable by start date, end date, and campaign. |
|
CPM by channel |
It shows the row chart of the cost of thousand impressions of ad by channel, calculated as spend divided by impressions. It is shown in thousands. Filterable by start date, end date, and campaign. |
|
Impressions and reach in time |
It shows the bar chart of impressions, unique reached users, and average frequency of impressions by each person, plotted by time, calculated as impressions divided by unique reached users. Filterable by start date, end date, and campaign. |
|
CPC and CTR in time |
It shows the bar chart of CPC (costs per click) and CTR (ratio of users who clicked on the ad to the users who viewed the ad) by time. CPC is computed as spend divided by clicks. CTR is computed as clicks divided by impressions. Filterable by start date, end date, and campaign. |
|
Campaign funnel |
It shows the funnel for ad performance from impression to click. Filterable by start date, end date, and campaign. |
|
Campaign insights by channel |
It shows campaign insights for each campaign, also by channel and totals. Filterable by start date, end date, channel, and campaign. |
No Comments