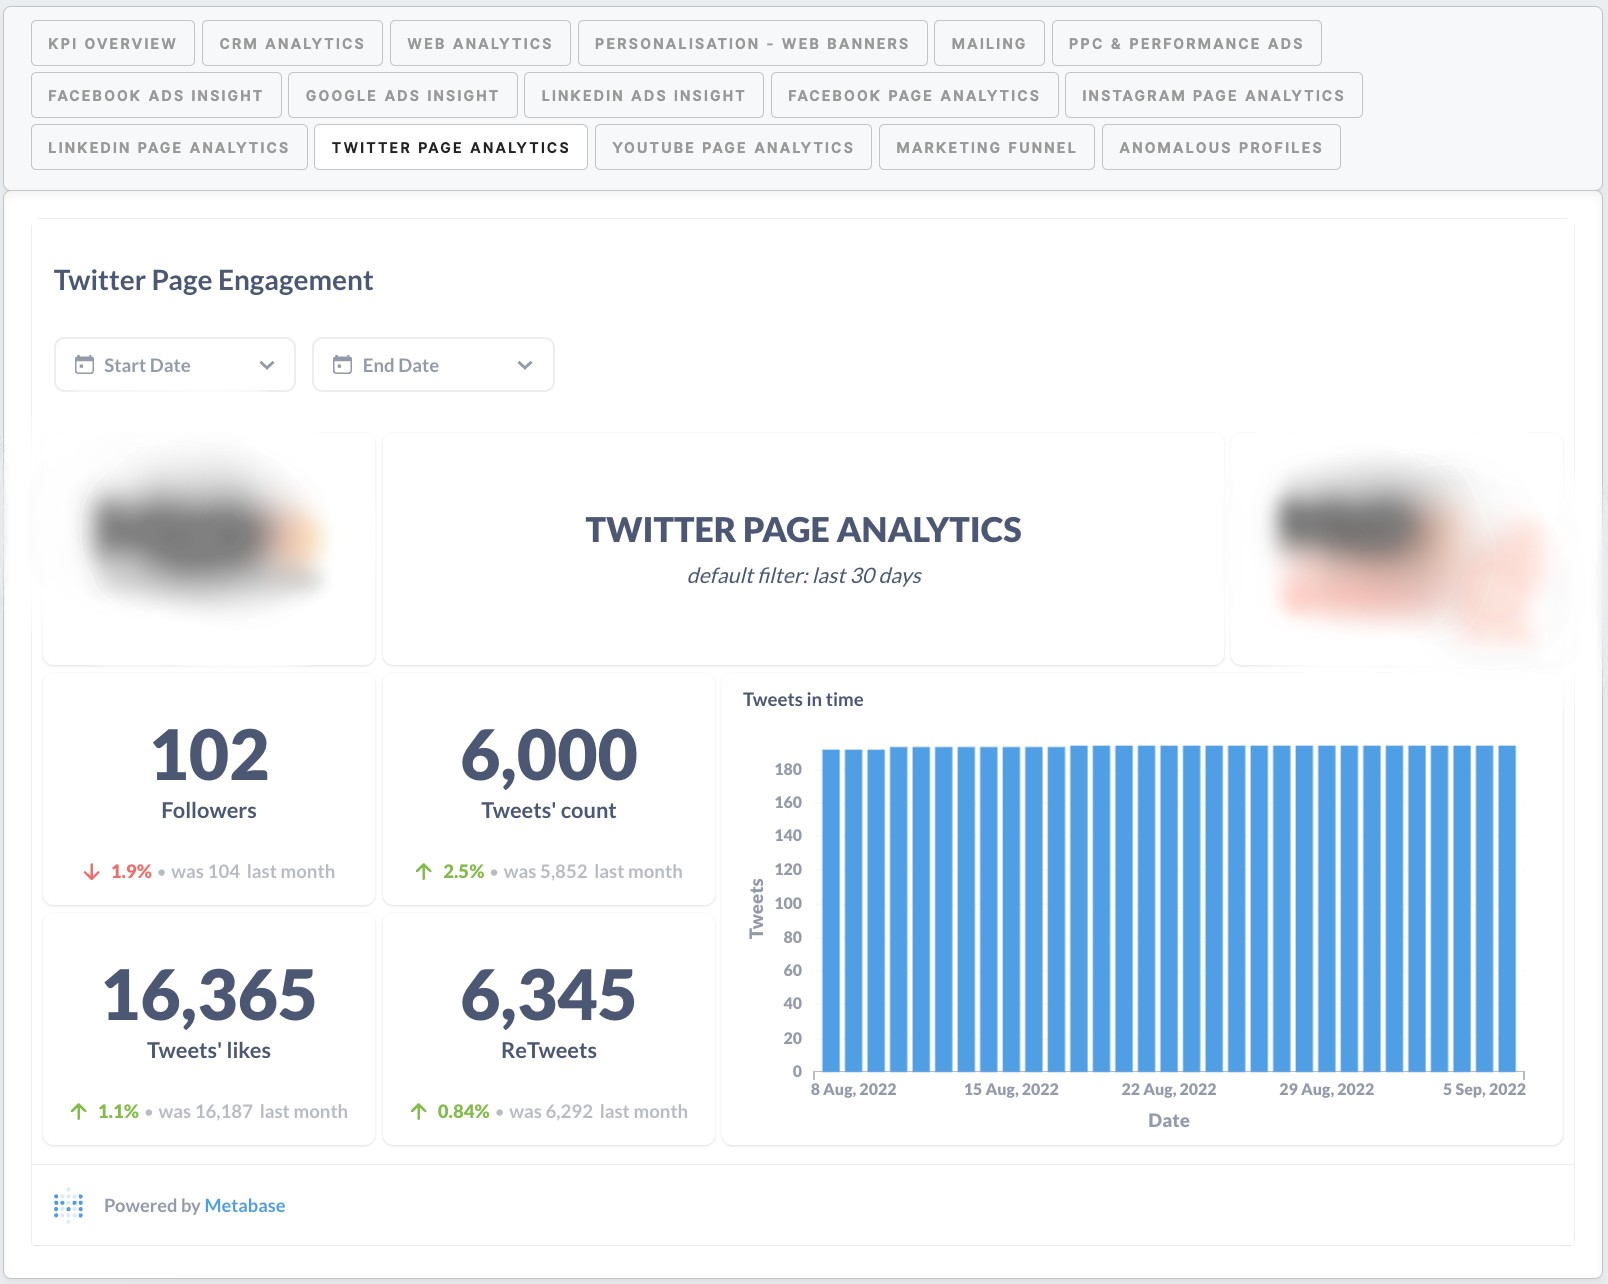
Reporting dashboard example: Twitter page analytics
|
Followers |
It shows the total number of followers. Filterable by start date and end date. The default filter is 30 days. Choose week or month and compare: set week with the previous one, or set month with the previous one |
|
Tweets' count |
It shows the total number of Tweets. Filterable by start date and end date. The default filter is 30 days. Choose week or month and compare: set week with the previous one, or set month with the previous one. |
|
Tweets' likes |
It shows the total number of Tweets' likes. Filterable by start date and end date. The default filter is 30 days. Choose week or month and compare: set week with the previous one, or set month with the previous one. |
|
ReTweets |
It shows the total number of reTweets. Filterable by start date and end date. The default filter is 30 days. Choose week or month and compare: set week with the previous one, or set month with the previous one. |
|
Tweets in time |
It shows the bar chart of the number of Tweets by time. Filterable by start date and end date. The default filter is 30 days. |


No Comments