Web: reporting on banner performance
|
Prerequisites To work with on-site personalization, first, they need to be set by the Meiro team: 1. Activation of the endpoint in the Meiro Events (ME) system should be implemented in order to collect events. 2. Meiro Events API connection must be set in the Administration/Configurations/Settings tab. 3. Channels/Web tabs must be enabled by the administrator for your user role. 4. For native banners, it is required to place a DOM element with a unique ID in the HTML code of the website where the banner will be displayed. |
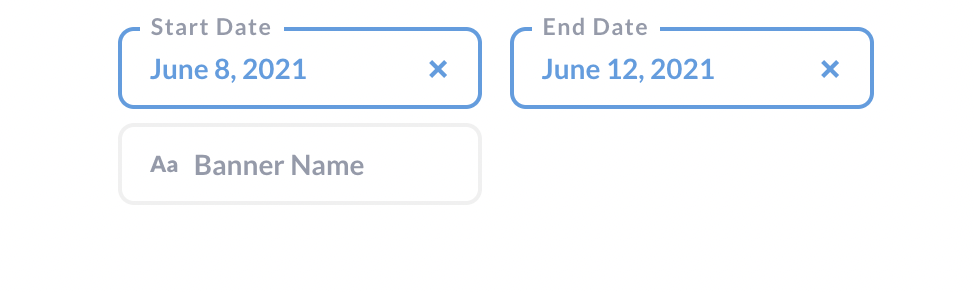
| Timeframe | Select the timeframe for reporting |
| Banner name | Select the banner name to check the performance of a particular banner. Otherwise, reporting will be displayed for all banners in total. |
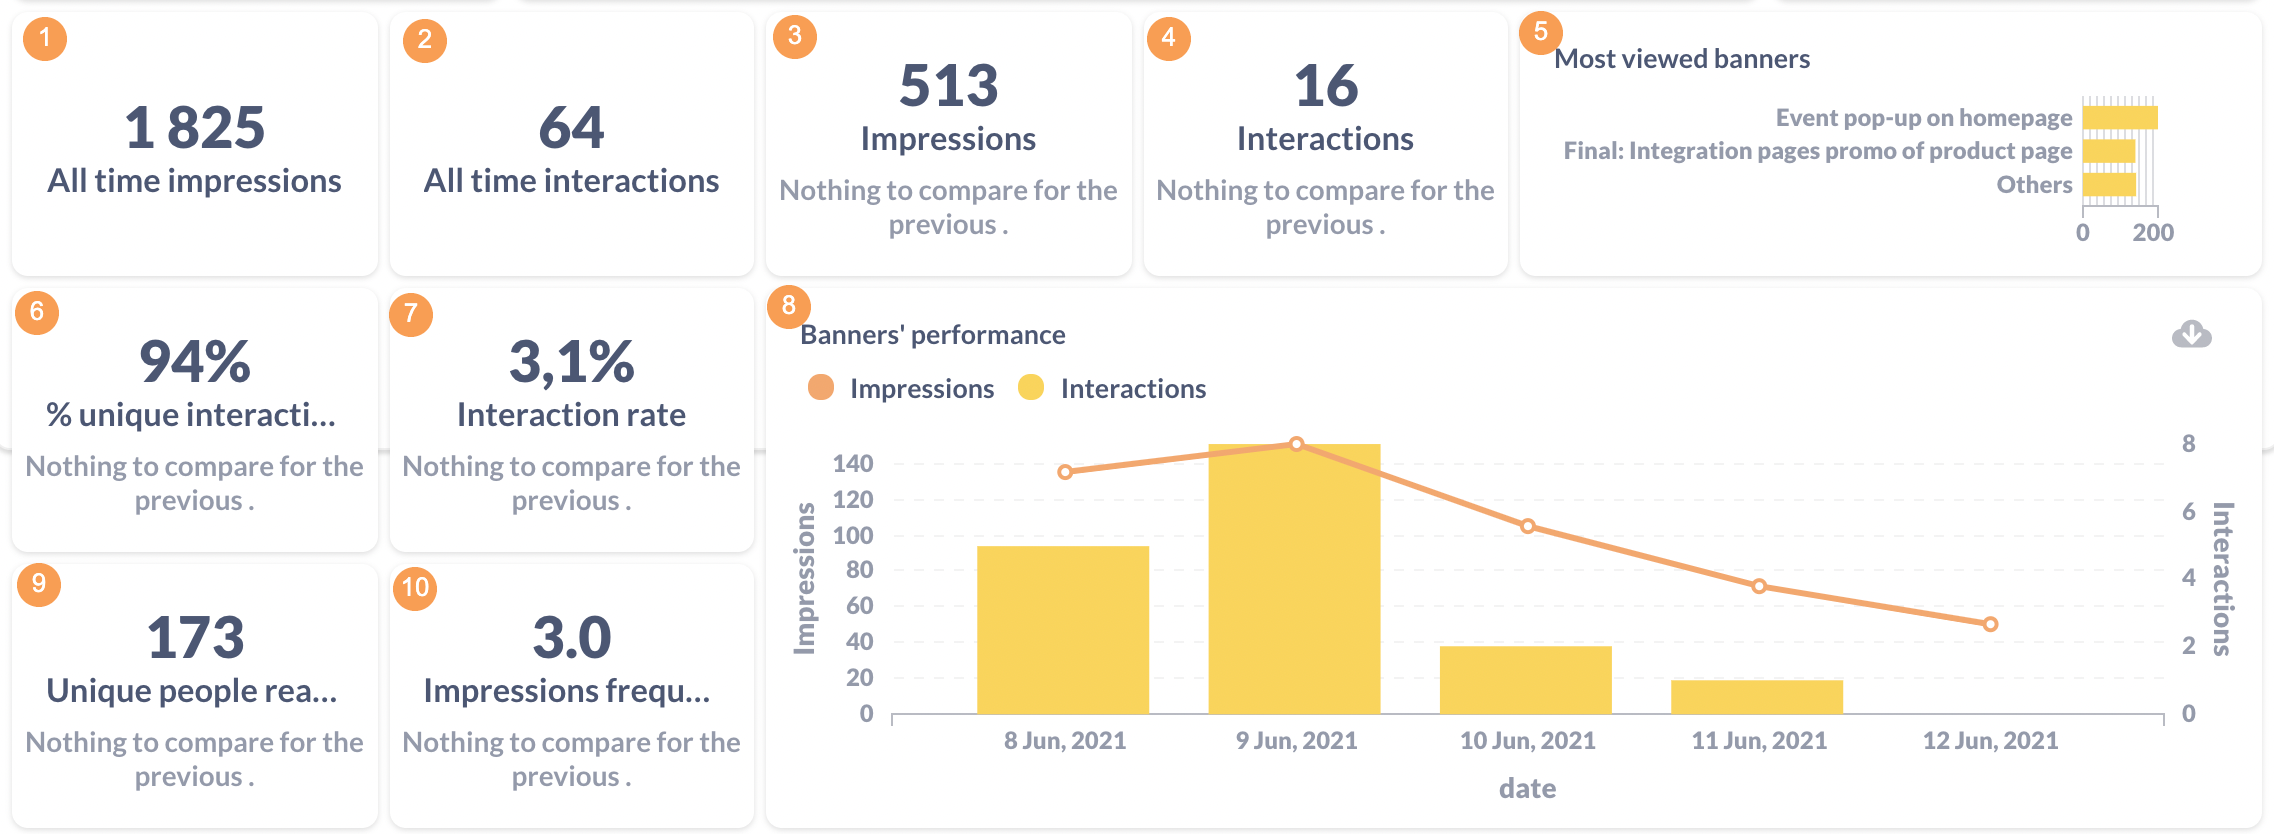
| All-time Impressions (1) | The total count of impressions generated by a specific banner or across all banners. |
|
All interactions (2) |
The lifetime number of interactions. Filterable by the banner. |
|
Impressions (3) |
Number of impressions in the selected period. Filterable by start date, end date, banner name, type, and status. When choosing a time period, week or month, then trend compares week with the week before that and month with the month before that. |
|
Interactions (4) |
Number of interactions in the selected period. Filterable by start date, end date and banner name, type and status. When choosing time period week or month then trend compares week with the week before that and month with the month before that. |
|
Most viewed banners (5) |
Number of impressions per banner in the selected period. Filterable by start date, end date and banner name, type and status. Calculated as number of impressions group by banner name. |
|
% Unique interactions (6) |
Showing the percentage of interactions that have been made by unique users in the selected period. 100% means that all interactions were made by unique users. Filterable by start date, end date and banner name, type and status. When choosing time period week or month then trend compares week with the week before that and month with the month before that. |
|
Interaction Rate (7) |
The percentage of users who interacted with a banner out of the total number of users who viewed it. |
|
Banners performance (8) |
Showing a number of transactions and its revenue and AOV per banner as well as impressions, interactions, and, most importantly, conversion rate from impression to transaction. AOV is Average order value calculated as division between revenue and number of transactions. CR is a conversion rate calculated as division between interactions and number of transactions. CPI is a conversion rate calculated as division between impressions and number of transactions. Filterable by start and end date, banner name, type and status. |
|
Unique people reached (9) |
Number of unique people reached in the selected period. Filterable by start date, end date and banner name, type and status. When choosing a time period week or month then trend compares week with the week before that and month with the month before that. |
|
Impressions Frequency (10) |
The average number of times an individual user has been exposed to a particular banner within a specified time frame. |
Additional metrics that can be implemented for web banner reporting
|
Impressions per user |
Number of impressions per user in the selected period. Filterable by start date, end date and banner name, type and status. Calculated as number of impressions divided by number of visitors. When choosing time period week or month then trend compares week with the week before that and month with the month before that. |
|
Interactions per user |
Number of interactions per user in the selected period. Filterable by start date, end date and banner name, type and status. Calculated as number of interactions divided by number of users. When choosing time period week or month then trend compares week with the week before that and month with the month before that. |
|
Total banners performance |
Showing number of transactions and its revenue and AOV per banner as well as impressions, interactions, and most importantly conversion rate from impression to transaction in two attribution model windows (Same Session and Direct).
AOV is the Average order value calculated as a division between revenue and number of transactions. CR is a conversion rate calculated as a division between interactions and number of transactions. CPI is a conversion rate calculated as a division between impressions and number of transactions. Filterable by start and end date, banner name, type and status. |
|
Transactions |
Number of transactions in the selected period. Filterable by start date, end date and banner name, type and status. When choosing time period week or month then trend compares week with the week before that and month with the month before that. |
|
Most interacted banner |
Most interacted banners in the selected period. Filterable by start date, end date and banner name, type and status. Calculated as sum of interactions. |
|
Revenue (currency) |
Sum of prices orders in the selected period. Filterable by start date, end date and banner name, type and status. When choosing time period week or month then trend compares week with the week before that and month with the month before that. |
|
Banners’ performance in time |
Time series for number of impressions and interactions in the selected period. Filterable by start date, end date and banner name, type and status. |
|
Funnel |
Percentages for the specific steps within the funnel are always counted towards the total number of impressions in the selected period. Filterable by start date, end date and banner name, status and type. |
|
Revenue per user (currency) |
Total sum of prices orders per user in the selected period. Filterable by start date, end date and banner name, type and status. Calculated as sum of orders divided by number of users. When choosing time period week or month then trend compares week with the week before that and month with the month before that. |
|
Banners run time in days |
It is the number of days with at least one impression of the banner. Filterable by banner and status. |
No Comments