Tab: Analytics
|
Learn from this article about: |
Diagnostic Dashboard tab
The Diagnostic Dashboard summarizes available customer profile data: update time, number of customer profiles, events, attributes, and more.
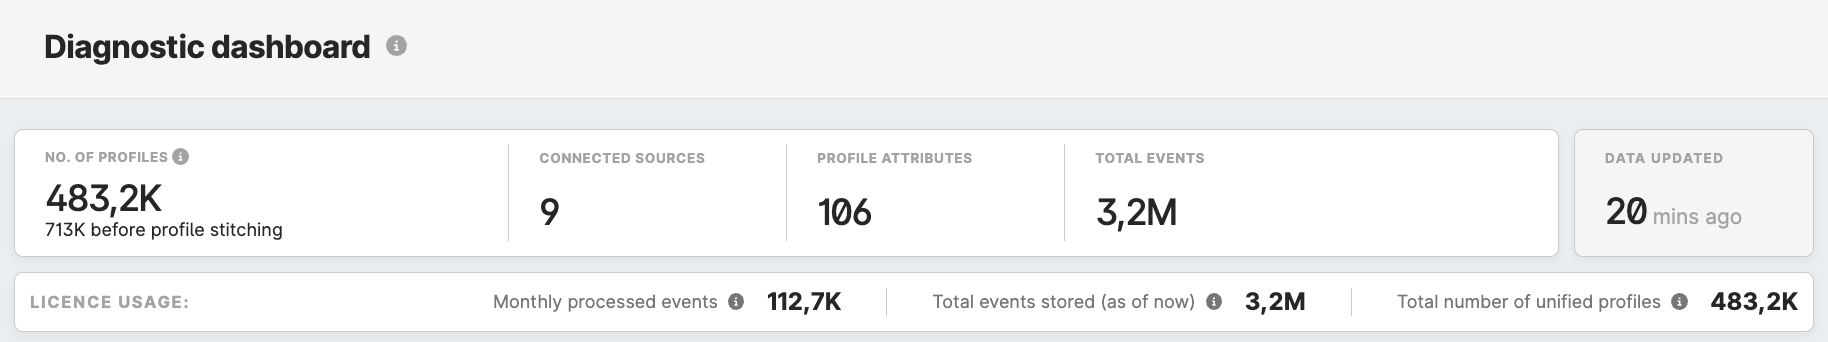
- The number of profiles
- Connected sources
- Profile attributes
- Total events
- Data updated
- Monthly processed events
- Total events stored (as of now)
- The number of unified profiles
Learn more: about examples of charts under the Diagnostic dashboard.
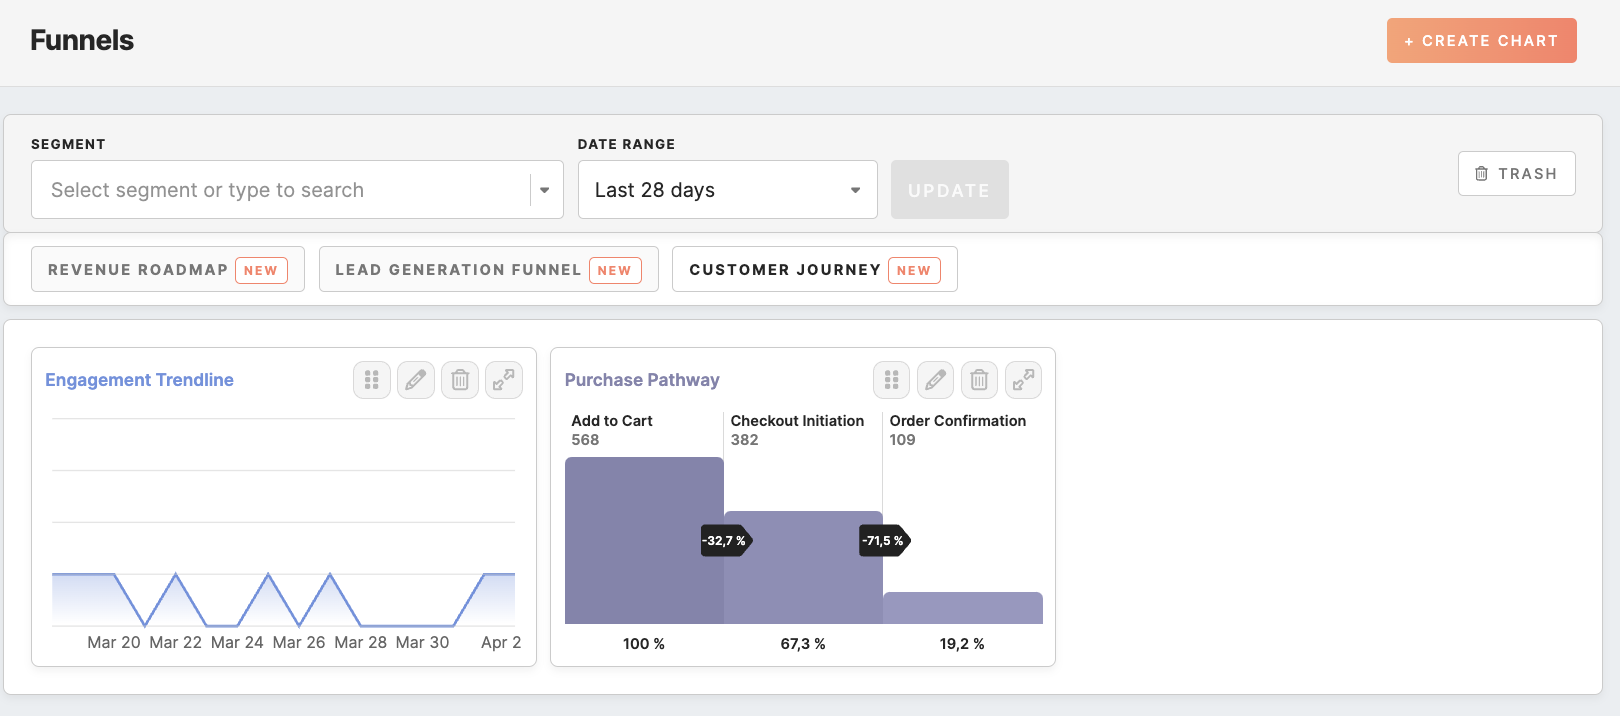
Funnels tab
Funnels are an analytical tool designed to unveil insights into user behavior and track conversion rates toward specific objectives. By visualizing the customer journey through various stages, such as completing a purchase or signing up for a service, funnels offer a clear depiction of user progression and potential bottlenecks.
The Funnels tab offers access to insights across the entirety of profiles stored within the CDP. Users can delve into the comprehensive dataset, examining user behavior and attribute values with ease. Additionally, the tab enables focused analysis through segmentation, allowing users to apply filters and tailor their exploration to specific segment.
Learn more: about funnels and how they work in this article
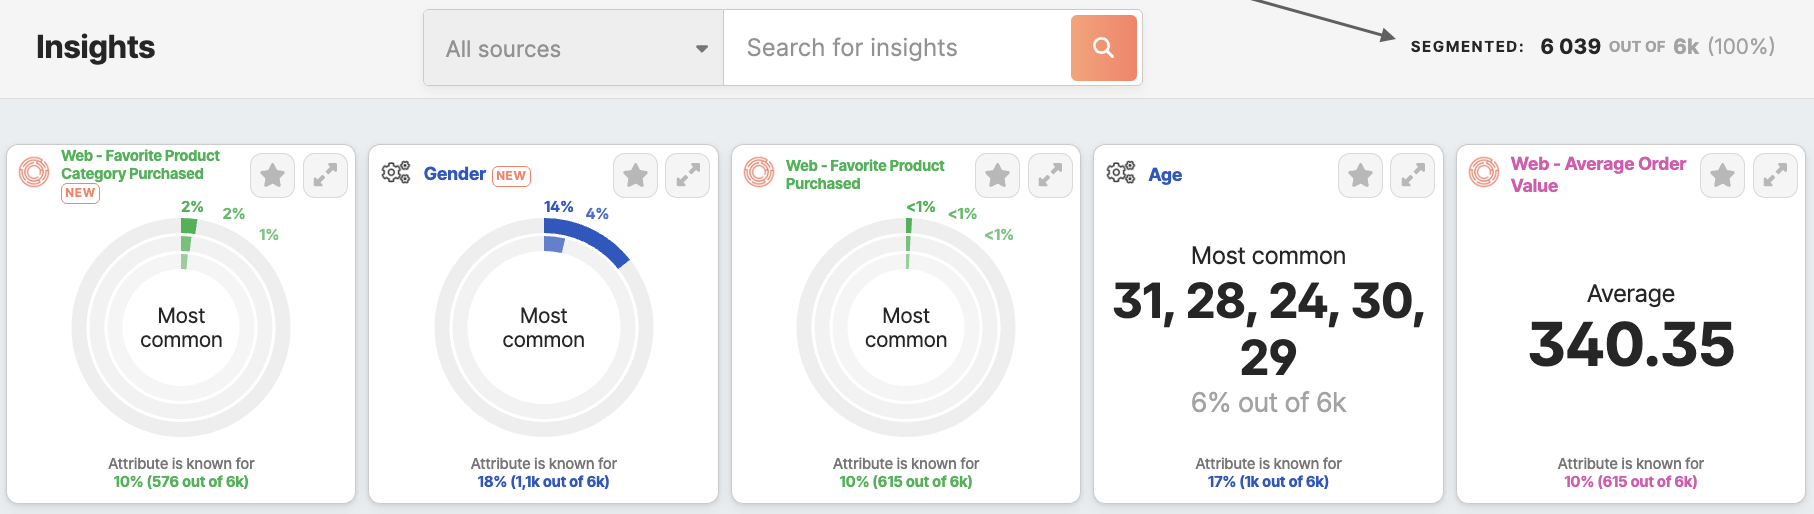
Insights tab
Insights for all the customer profiles databases are in the Analytics/ Insights tab. Insights for each segment are in the Segment Detail/ Insights tab.
Search through insights:
- By name
- By data source of the attribute, the insight is calculated from
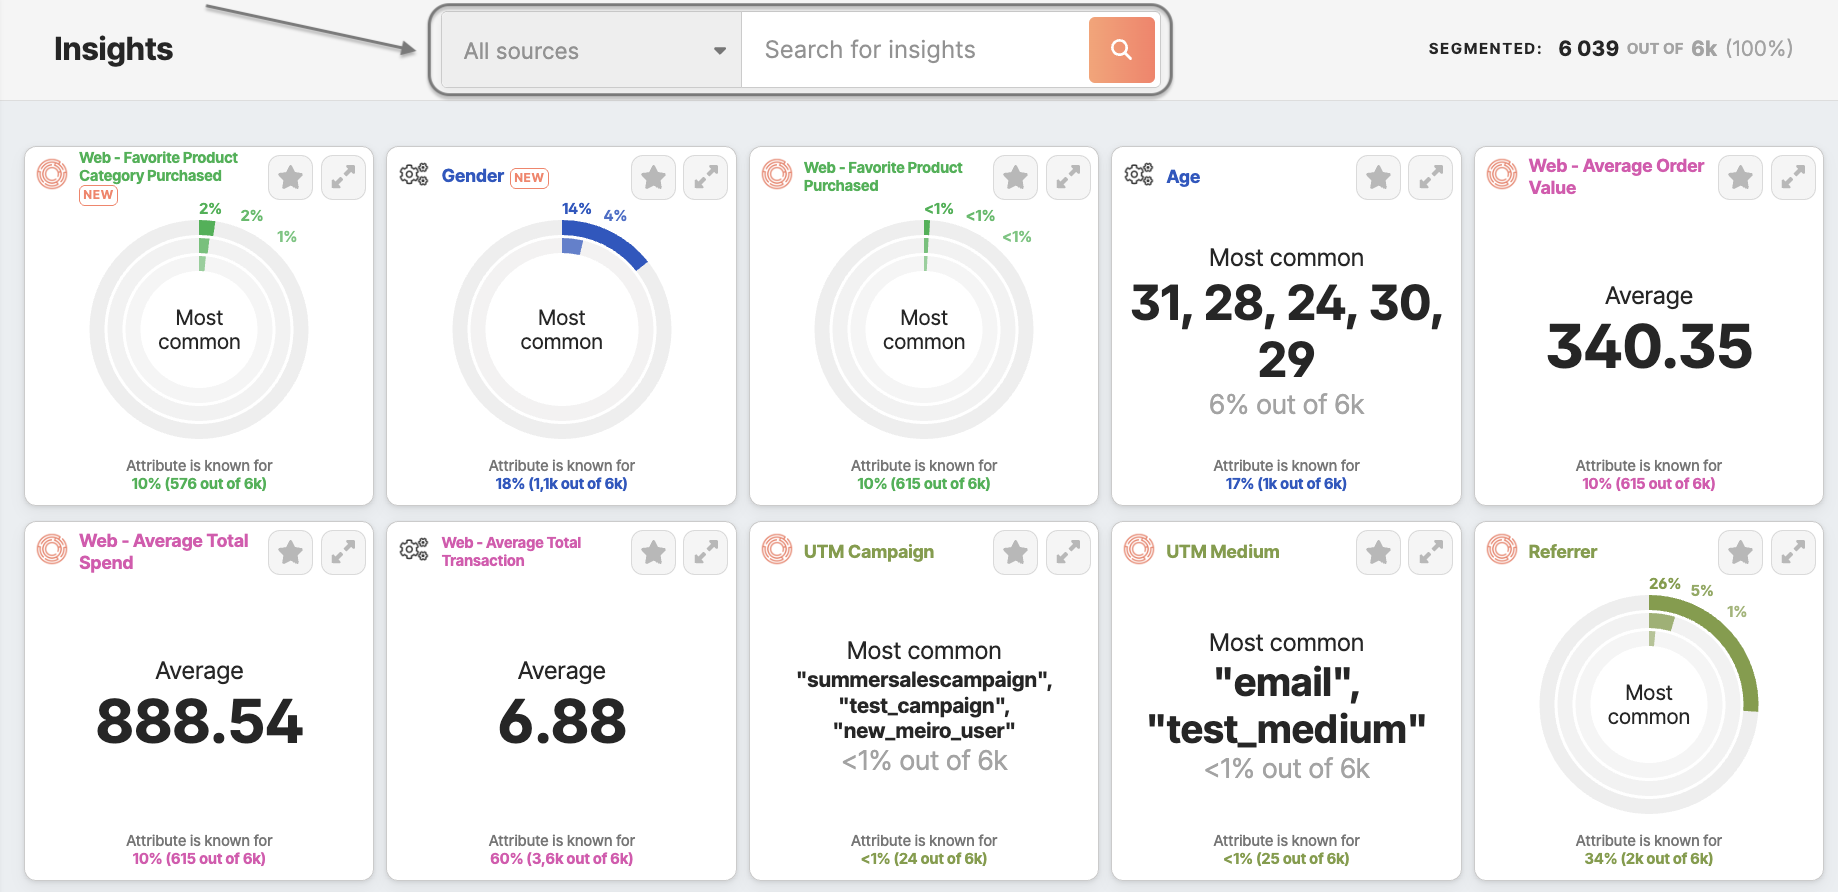
See how many customer profiles your insights are calculated for:
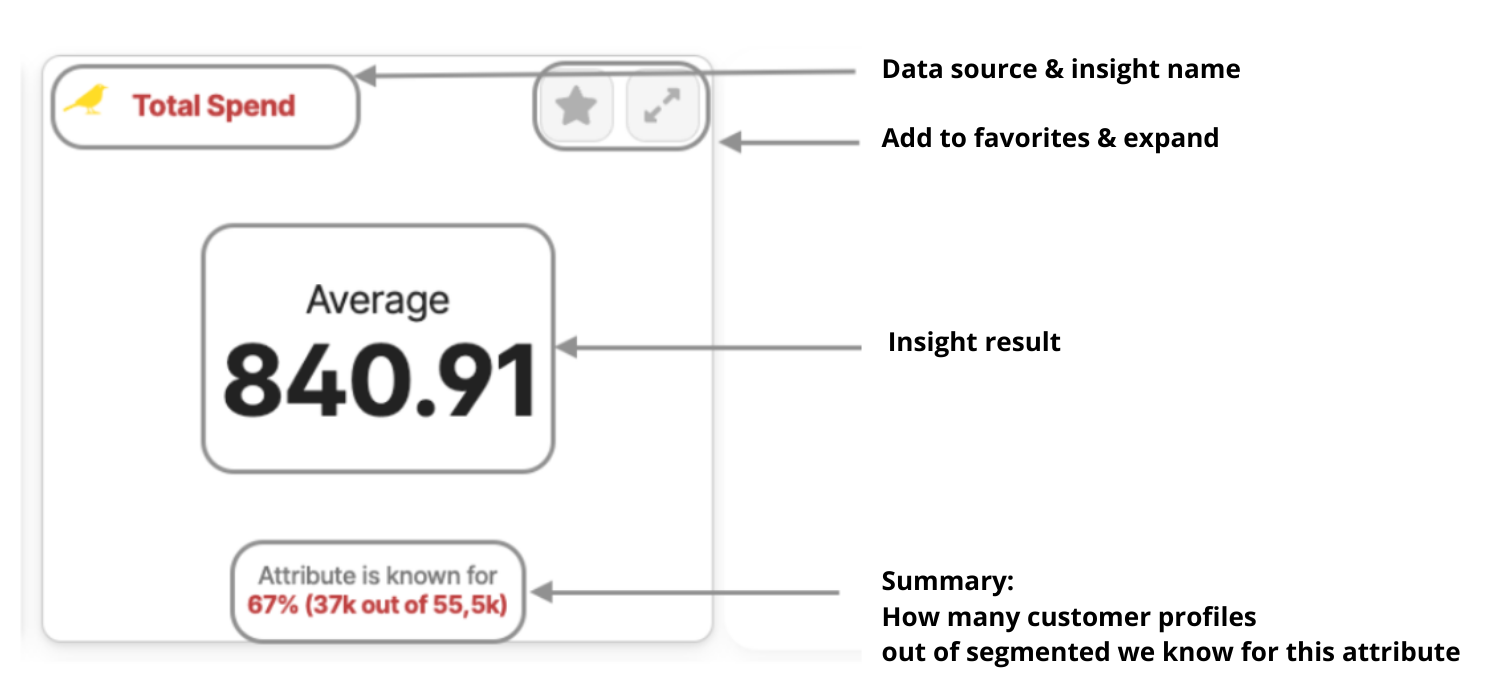
Learn more: what are insights and how do they work.
Reporting tab
The Reporting tab is set by the Meiro team in an external tool (Metabase).
Basic dashboards are available for each client within Meiro Business Explorer, as well as customized dashboards at additional costs. To learn more, please get in touch with the Meiro team.
If reporting is set and ready to use, it will be visible under the Reporting tab.

Learn more: about available reporting dashboards templates. Please remember that reporting can be customized to clients' needs and data. To learn more, contact the Meiro team.
No Comments