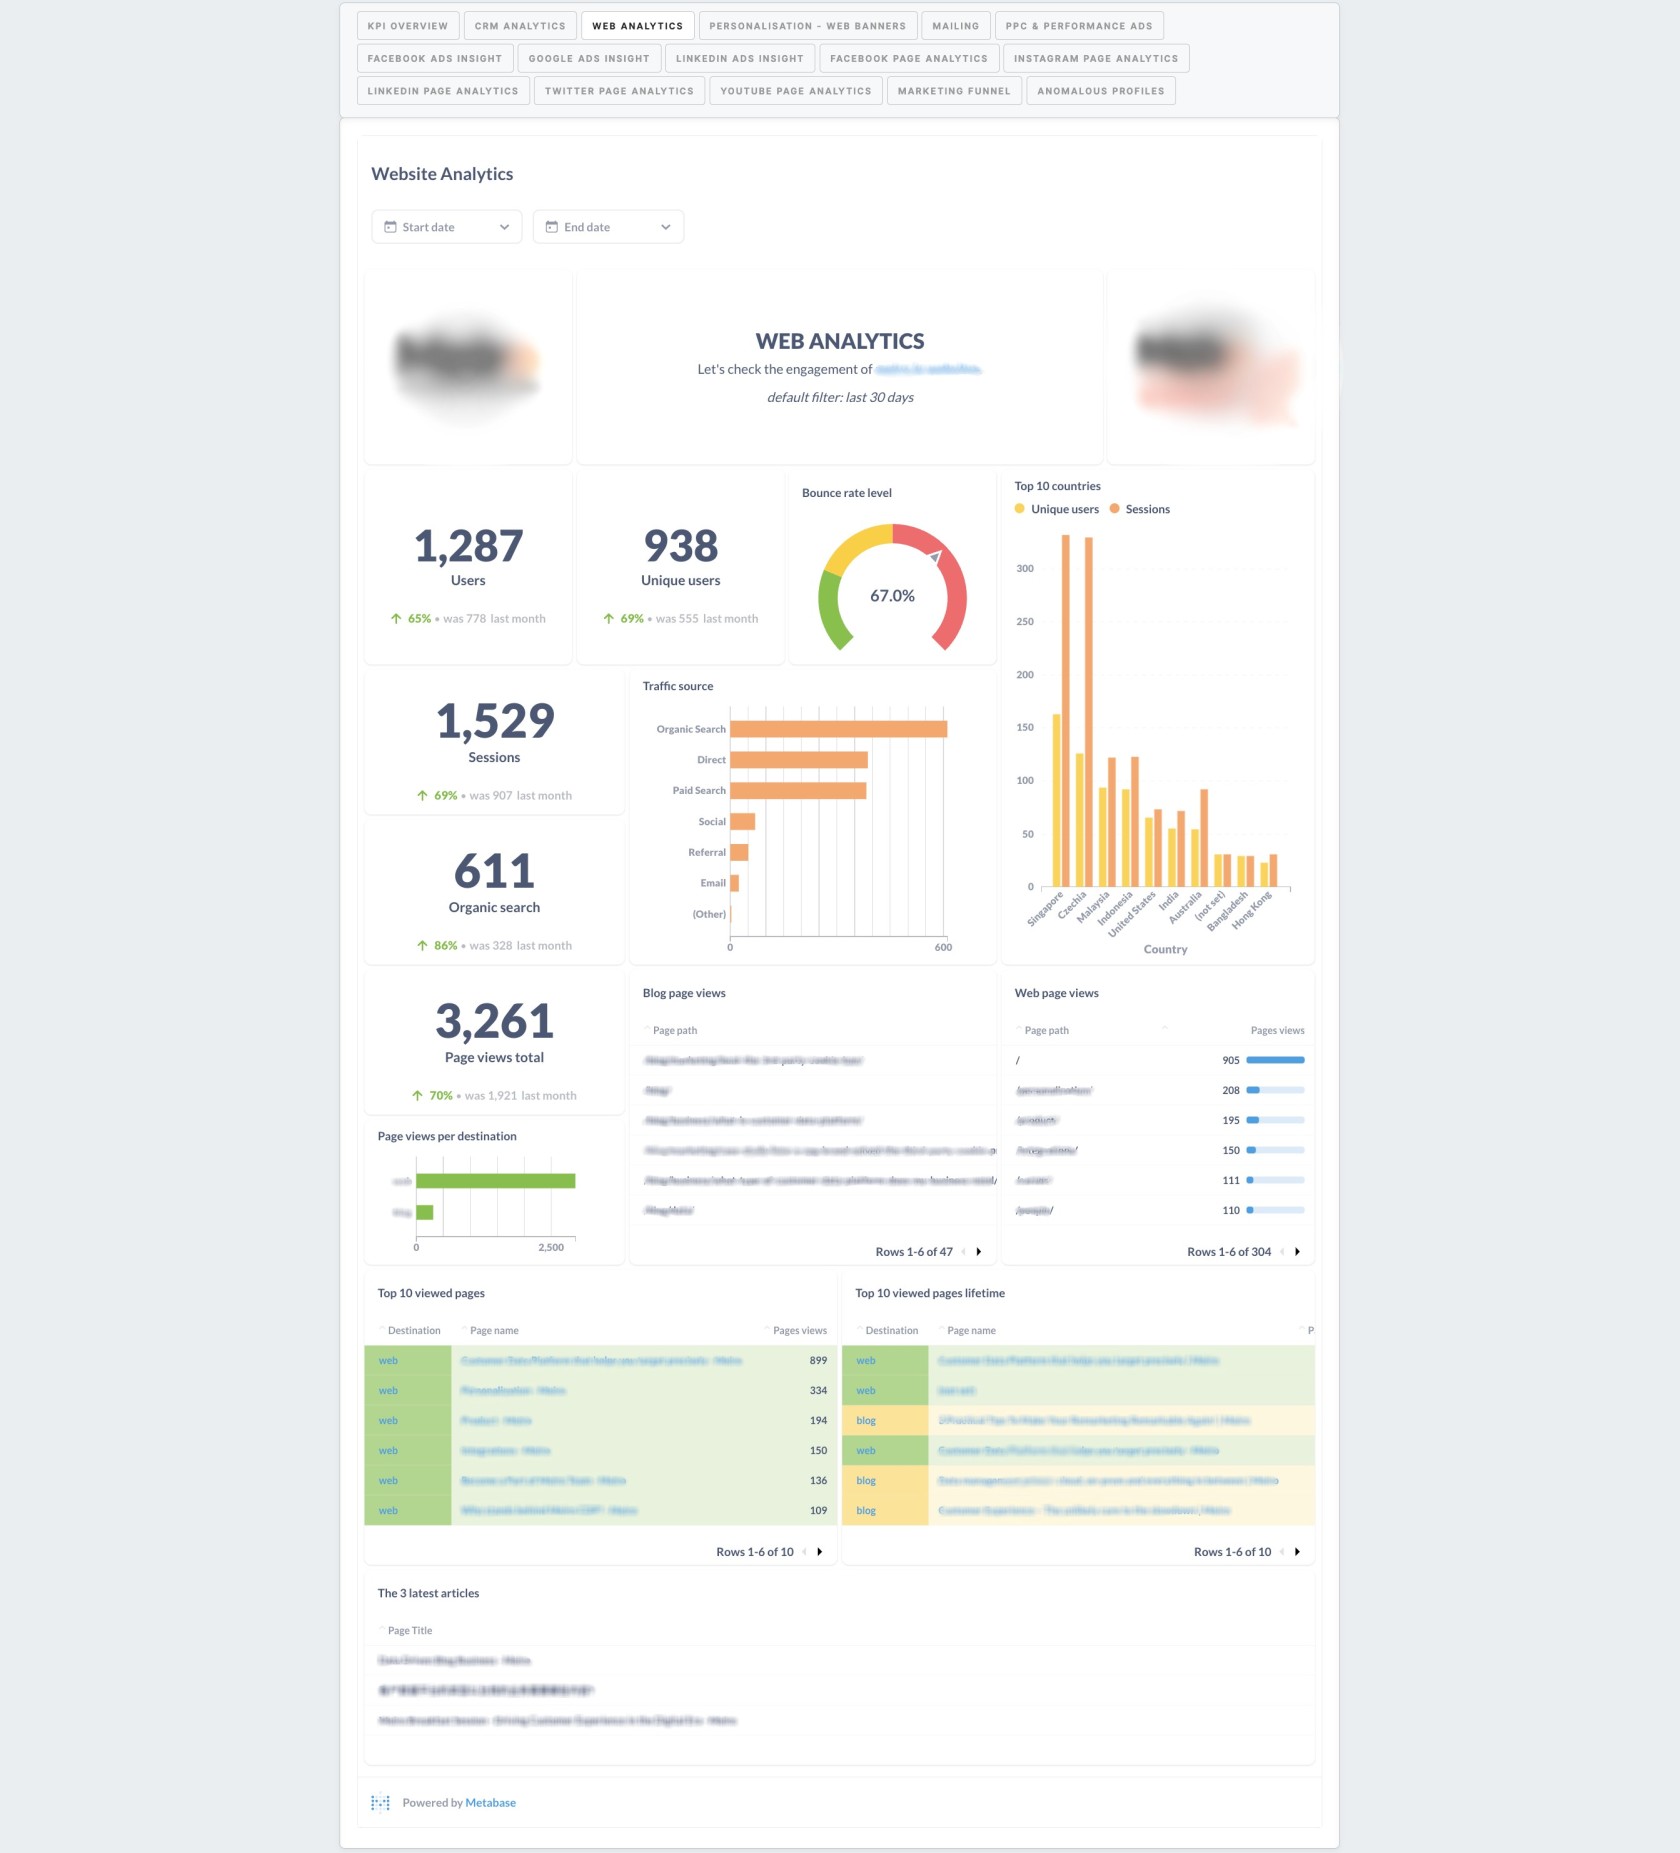
Reporting dashboard example: Web analytics
|
Users |
It shows the number of users who visited a website in the selected period, calculated as the sum of users on a website. Filterable by start date, end date, and traffic source. The default period is 30 days. Choose week or month and compare: set week with the previous one, or set month with the previous one. |
|
Unique users |
It shows the number of unique users who visited a website in the selected period, calculated as the sum of users on a website Filterable by start date, end date, and traffic source. The default period is 30 days. |
|
Bounce rate level |
It shows the average bounce rate (percentage of visitors who enter the site and leave) in the selected period, calculated as the average bounce rate from Google Analytics. Filterable by start date, end date, and traffic source. The default period is 30 days. |
|
Sessions |
It shows the number of sessions on a website in the selected period, calculated as the sum of sessions on a website. Filterable by start date, end date, and traffic source. The default period is 30 days. Choose week or month and compare: set week with the previous one, or set month with the previous one. |
|
Organic search |
It shows the number of sessions on a website only for traffic source organic search in the selected period, calculated as the sum of sessions. Filterable by start date and end date. The default period is 30 days. Choose week or month and compare: set week with the previous one, or set month with the previous one. |
|
Traffic source |
It shows the number of sessions per traffic source in the selected period. Filterable by start date, end date, and traffic source. The default period is 30 days. |
|
Top 10 countries |
It shows the number of new users and sessions by users' country in the selected period, calculated as the sum of new users on a website and sessions for the top 10 countries with the highest number of users. Filterable by start date and end date. The default period is 30 days. |
|
Pageviews total |
It shows the number of total page views for web and blog) in the selected period, calculated as the sum of page views from Google Analytics. Filterable by start date, end date, and traffic source. The default period is 30 days. Choose week or month and compare: set week with the previous one, or set month with the previous one. |
|
Pageviews per destination |
It shows the number of page views for web and blog, calculated as the sum of page views. Filterable by start date and end date. The default period is 30 days. |
|
Blog page views |
It shows pageviews per specific page on the blog in the selected period, calculated as the sum of page views from Google Analytics. Filterable by start date and end date. The default period is 30 days. |
|
Web page views |
It shows pageviews per specific page on the web (excludes blog) in the selected period, calculated as the sum of page views from Google Analytics. Filterable by start date and end date. The default period is 30 days. |
|
Top 10 viewed pages |
It shows the most viewed pages on the web (includes blog) in the selected period, calculated as the sum of page views from Google Analytics. Filterable by start date and end date. The default period is 30 days. |
|
Top 10 viewed pages lifetime |
It shows the most viewed pages on the web (includes blog) throughout the lifetime, calculated as the sum of page views from Google Analytics. |
|
The 3 latest articles |
It shows the 3 latest released articles. Note: released articles with no traffic are not excluded. |


No Comments