Reporting dashboard example: Meiro Emails
Engagement metrics
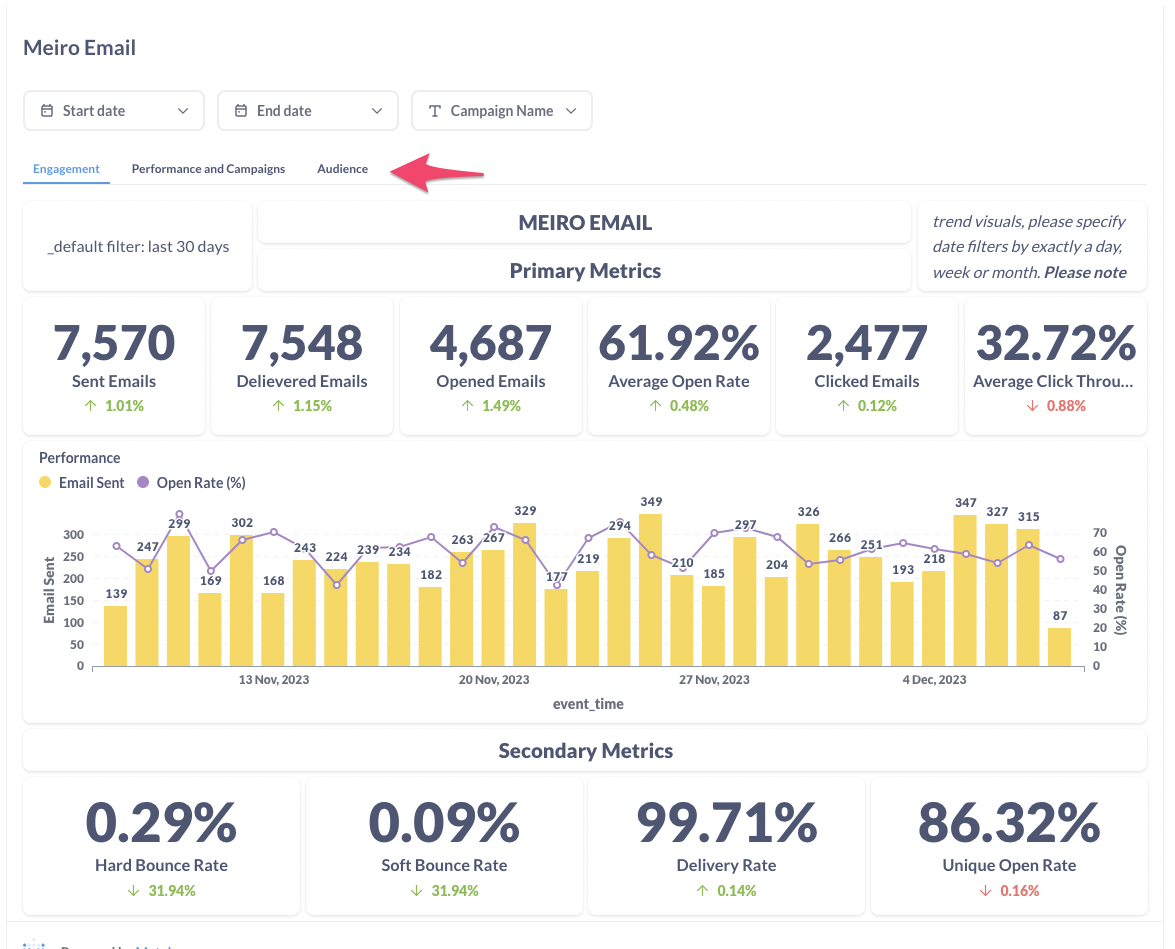
Remember: use the campaign filter at the top of the reporting dashboard to view metrics specific to each campaign.
|
Sent Emails |
It shows the number of emails sent. Filterable by start date and end date. The default period is 30 days. Choose a week or month and compare: set a week with the previous one or a month with the previous one. |
|
Delivered emails |
It shows the number of emails successfully transmitted to recipients' mail servers or inboxes without bouncing back. |
|
Opened Emails |
It shows the number of opened emails. Filterable by start date and end date. The default period is 30 days. Choose a week or month and compare: set a week with the previous one or a month with the previous one. |
|
Average Open rate |
Represents the average percentage of opened emails. It is calculated by dividing the number of clicked emails by the number of opened emails. You can filter the results by start date and end date. When comparing time periods (week or month), the trend compares the current week or month with the previous one. |
|
Clicked Emails |
It shows the number of email clicks. Filterable by start date and end date. Choose a week or month and compare: set a week with the previous one or a month with the previous one. |
|
Average Click through rate |
Represents the average percentage of clicked emails. It is calculated by dividing the number of clicked emails by the number of delivered emails. You can apply filters based on the start date and end date. When comparing time periods (week or month), the trend compares the current week or month with the previous one. |
|
Performance |
This performance graph tracks the total emails sent for each campaign ('Sent') and the Conversion Rate ('CR'). 'Sent' measures the outreach scale, representing the quantity of emails dispatched. 'CR' indicates the percentage of recipients who not only opened the email but also took a desired action, revealing the campaign's effectiveness in driving meaningful engagement and conversions. |
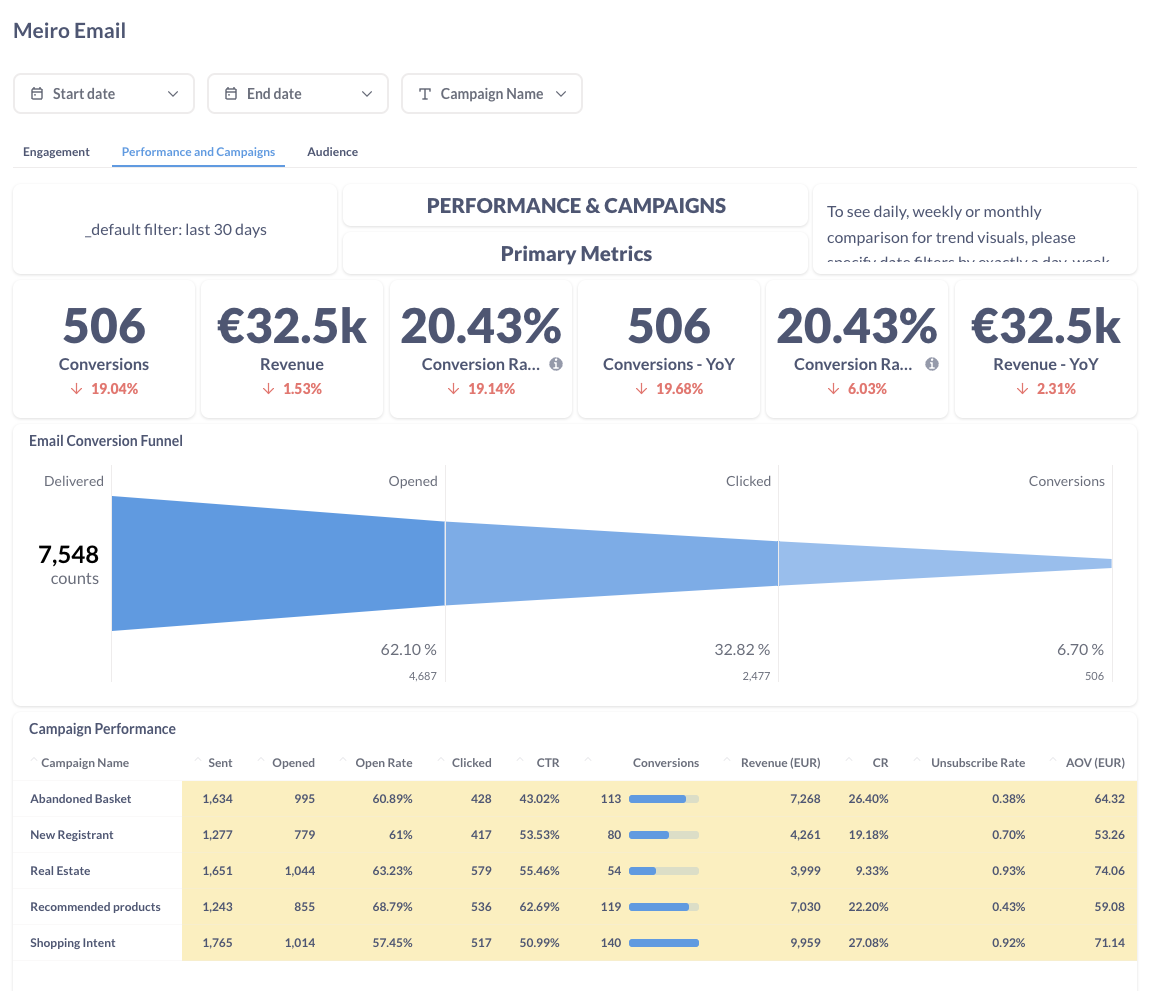
Performance and campaigns metrics
|
Conversions |
It shows the number of conversion counts achieved through the campaign. Filterable by start and end date, campaign name, and conversion window. |
|
Revenue |
Displays the total revenue generated from the campaigns. |
|
CR (Conversion Rate) |
Calculates the average conversion rate within a specified attribution window. The conversion rate is determined by dividing the number of purchases by the number of email clicks. |
|
Conversions - YoY |
Compares the total counts of conversions achieved through the campaign on a year-over-year basis, offering insight into the campaign's performance and growth over time. Filter the campaign on top to see the metrics per campaign. |
|
Conversion Rate - YoY |
calculates the year-over-year trend in conversion rates by comparing the ratio of purchases to clicks, highlighting changes in the effectiveness of converting email engagements into actions across different periods. |
|
Revenue - YoY |
Evaluates the year-over-year change in total revenue generated from the campaigns. |
|
Email conversion funnel |
Displays the funnel for ad performance, starting from the email sent to the transaction. You can filter the results by start date, end date, and campaign name. The default period is 30 days. |
|
Campaign performance |
Provides a comprehensive overview of key metrics for campaigns within the specified Attribution Model Window:
|
Audience metrics
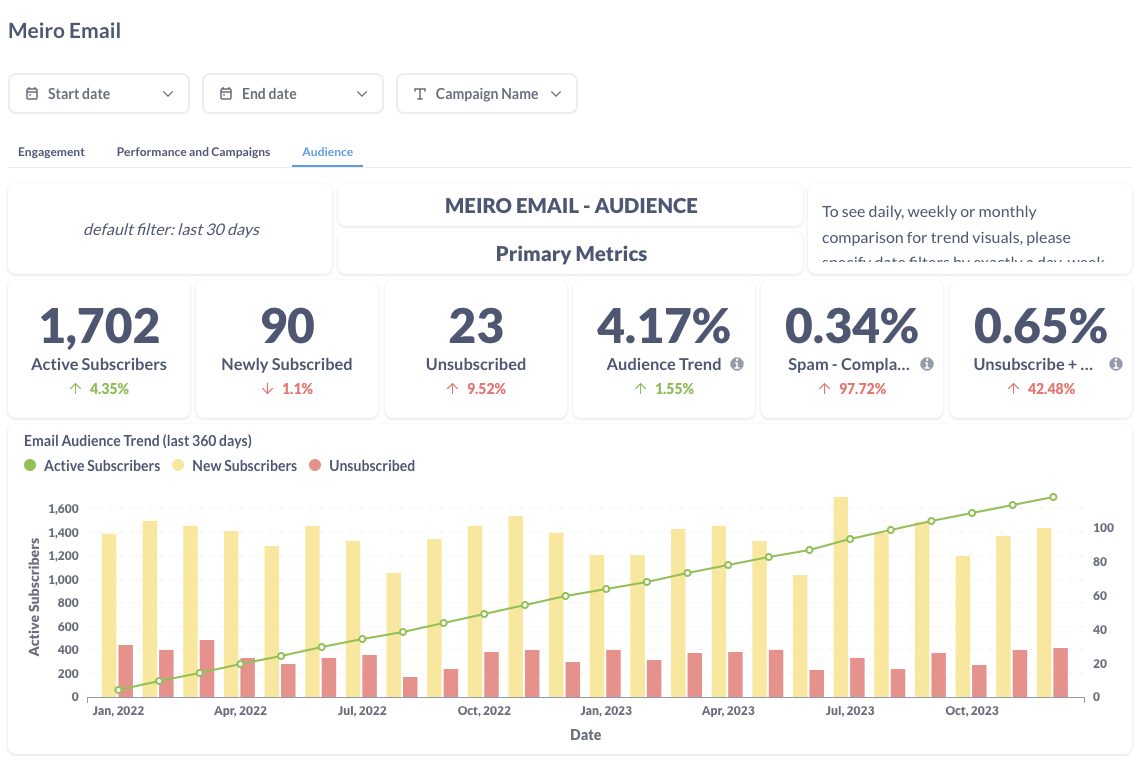
| Active subscribers | Represents the current count of recipients who remain engaged and subscribed to the campaign, reflecting the ongoing audience size actively receiving communications. |
| Newly subscribed | Represents the count of individuals who recently opted into the campaign or subscribed within a specified time frame, indicating the growth or acquisition of new audience members. |
| Unsubscribed | Measures the number of recipients who opted out or unsubscribed from the campaign within the defined period, providing insights into disengagement trends. |
| Audience trend | Represents the percentage change in subscribers over a specified period, calculated as the net difference between new subscriptions and unsubscribes relative to the total subscriber count. |
| Spam - Complaint Rate | The percentage of complaints received per delivered emails, reflecting the rate of reported issues or dissatisfaction among recipients. |
| Unsubscribe + Spam Complaint rate | signifies the combined percentage of unsubscribes and complaints received per delivered emails, providing a comprehensive view of disengagement and negative feedback among recipients. |
| Email Audience trend | showcases the changes in audience composition over time, depicting shifts in active subscribers, new subscriptions, and unsubscribed individuals in a single graph, offering insights into audience dynamics and campaign impact. |
No Comments