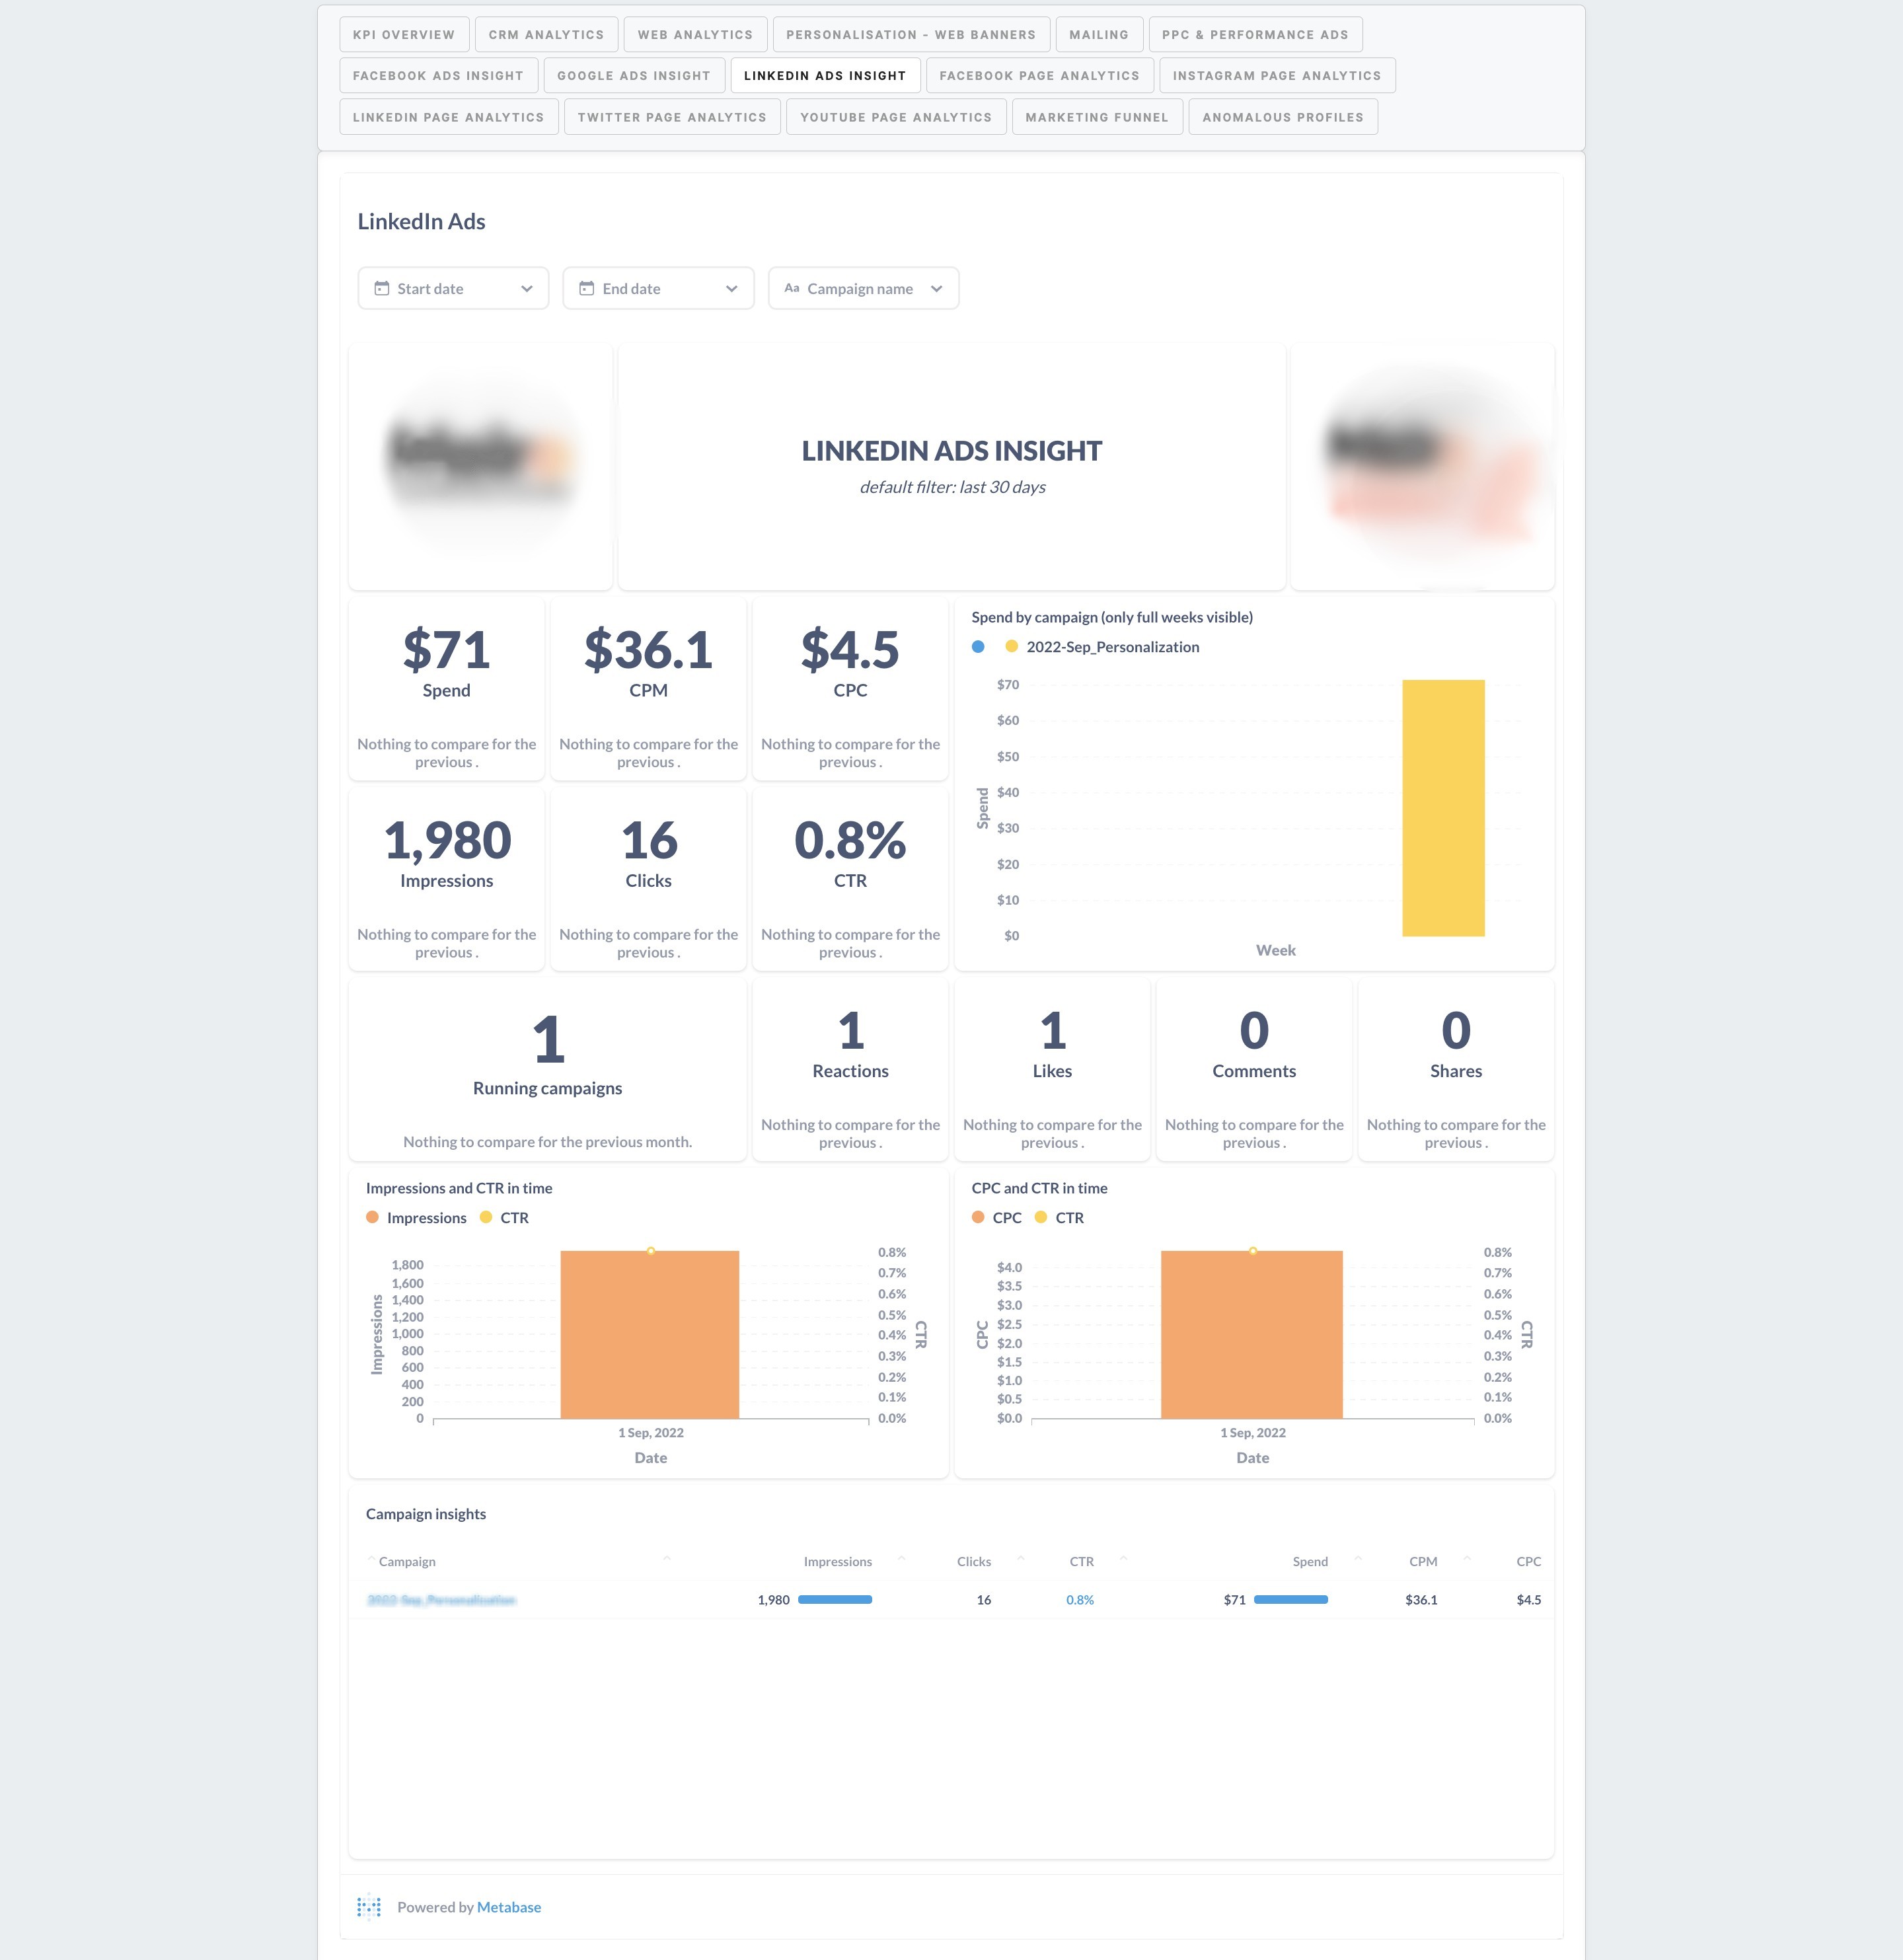
Reporting dashboard example: LinkedIN Ads insights
|
Spend |
It shows the total spend on campaigns. Filterable by start date, end date, and campaign. The default filter is 30 days. Choose week or month and compare: set week with the previous one, or set month with the previous one. |
|
CPM |
CPM- cost per thousand. Cost of thousand impressions of the ad. Computed as spending divided by impressions, and it is expressed in thousands. Filterable by start date, end date and campaign. The default filter is 30 days. |
|
CPC |
CPC- cost per click. The ratio of total spending on the ad to the users who clicked on the ad. Computed as total spend divided by clicks. Filterable by start date, end date, and campaign. The default filter is 30 days. |
|
Impressions |
It shows the total number of impressions. Filterable by start date, end date, and campaign name. The default filter is 30 days. Choose week or month and compare: set week with the previous one, or set month with the previous one. |
|
Clicks |
It shows the number of clicks. Filterable by start date, end date, and campaign name, the default filter is 30 days. Choose week or month and compare: set week with the previous one, or set month with the previous one. |
|
CTR |
CTR- click-through rate. It shows the ratio of users who clicked on an ad to the users who viewed the ad, computed as clicks divided by impressions. Filterable by start date, end date, and campaign name. The default filter is 30 days |
|
Spend by campaign (only full weeks visible) |
It shows the bar chart of spend on campaigns by date. Filterable by start date, end date and campaign name. The default filter is 30 days. |
|
Running campaigns |
It shows the pie chart of the number of running campaigns on each channel. Filterable by the end date. The default filter is 30 days. |
|
Reactions |
It shows the number of reactions. Filterable by start date, end date, and campaign name. The default filter is 30 days. Choose week or month and compare: set week with the previous one, or set month with the previous one. |
|
Likes |
It shows the number of likes. Filterable by start date, end date, and campaign name. The default filter is 30 days. Choose week or month and compare: set week with the previous one, or set month with the previous one. |
|
Comments |
It shows the number of comments. Filterable by start date, end date, and campaign name. The default filter is 30 days. Choose week or month and compare: set week with the previous one, or set month with the previous one. |
|
Shares |
It shows the number of shares. Filterable by start date, end date, and campaign name. The default filter is 30 days. Choose week or month and compare: set week with the previous one, or set month with the previous one. |
|
Impressions and CTR in time |
It shows the bar chart of impressions and CTR (the ratio of users who clicked on the ad to those who viewed it)—plotted by time, computed as clicks divided by impressions. Filterable by start date, end date, and campaign. The default filter is 30 days. |
|
CPC and CTR in time |
It shows the bar chart of CPC (costs per click) and CTR (ratio of users who clicked on the ad to those who viewed the ad) by time. CPC is computed as spend divided by clicks. CTR is computed as clicks divided by impressions. Filterable by start date, end date, and campaign. The default filter is 30 days. |
|
Campaign insights |
It shows campaign insights for each campaign, also by channel and totals. Filterable by start date, end date, channel, and campaign. The default filter is 30 days. |
No Comments