Processing Diagnostics
The Diagnostics page provides an overview of how customer data is currently being processed. It allows administrators to monitor the health of the data processing pipeline, understand whether data is being processed normally, and identify potential processing issues or errors.
Every event that enters the system, such as a website visit, purchase, or form submission, goes through several processing stages before it becomes available for segmentation, analytics, and activations. The Diagnostics page visualizes these stages and shows how many items are waiting to be processed, how quickly they are being processed, and whether the system is operating normally.
You can open the Diagnostics page in Administration → Diagnostics.
Data Processing Pipeline
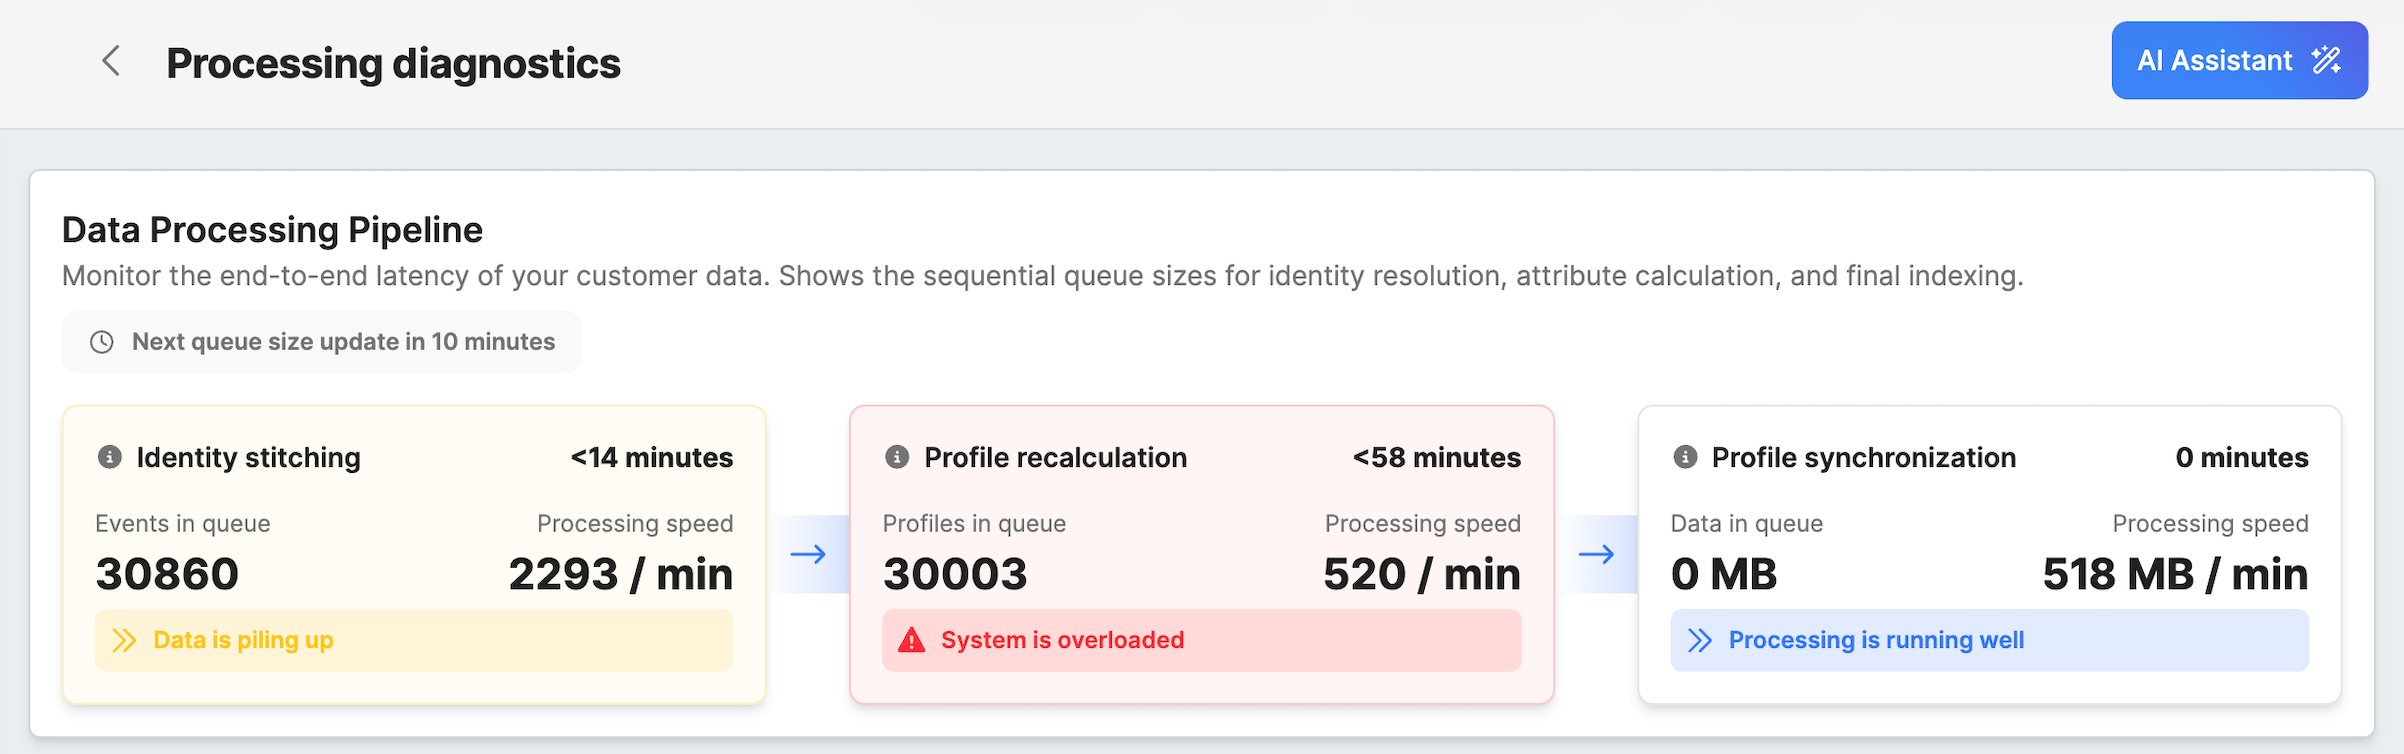
These stages are displayed as cards arranged from left to right, showing the sequential flow of data through the platform. Data first passes through Identity Stitching, then Profile Recalculation, and finally Profile Synchronization.
Each card contains several metrics that help you understand the current state of that processing stage.
The values shown in these cards are updated regularly to reflect the current state of the system.
Identity Stitching
Identity stitching is the first stage of the data processing pipeline. In this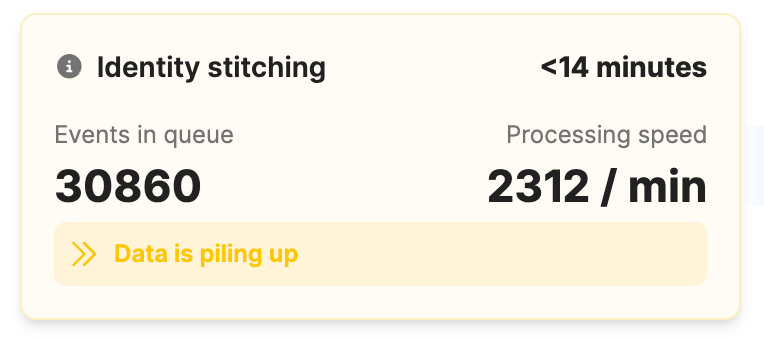 step, incoming events are matched with existing customer profiles. The system uses identifiers such as email address, cookie ID, or phone number to determine which customer profile an event belongs to.
For example, if a user visits your website and later makes a purchase using the same email address, the system will connect those events to the same customer profile.
The Identity Stitching card displays two main metrics: the number of events waiting to be processed and the current processing speed.
- The Events in queue value shows how many incoming events are currently waiting to be stitched to customer profiles. This number increases when new events arrive faster than they can be processed. Short spikes are normal, especially during periods of high activity.
- The Processing speed value shows how many events are being processed per minute. This number indicates the current processing throughput of the identity stitching engine.
If the queue grows significantly while the processing speed remains low, this may indicate that the system is temporarily processing a backlog of events.
Profile Recalculation
After an event has been successfully linked to a customer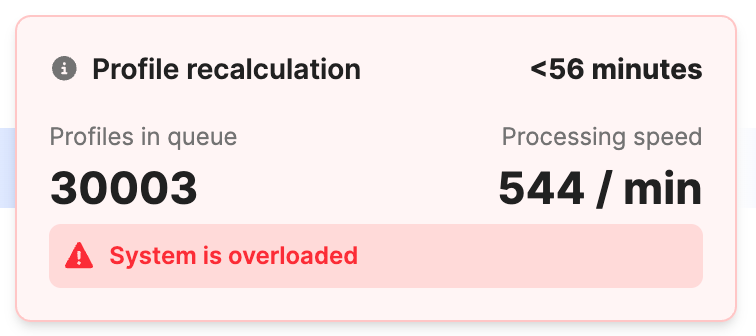 profile, the system may need to update that profile’s attributes. This happens in the Profile Recalculation stage.
Attributes are calculated values stored on the customer profile. Examples include the total number of purchases, the date of the last activity, or the number of times a user visited your website.
Whenever an event changes data that affects these attributes, the system schedules a recalculation for the affected profile.
- The Profiles in queue value shows how many customer profiles are currently waiting for attribute recalculation. If many profiles are affected by incoming events, this number may temporarily increase.
- The Processing speed value shows how many profiles are recalculated per minute.
If this queue grows continuously while the processing speed remains low, it may indicate that attribute recalculations are taking longer than expected.
Profile Synchronization
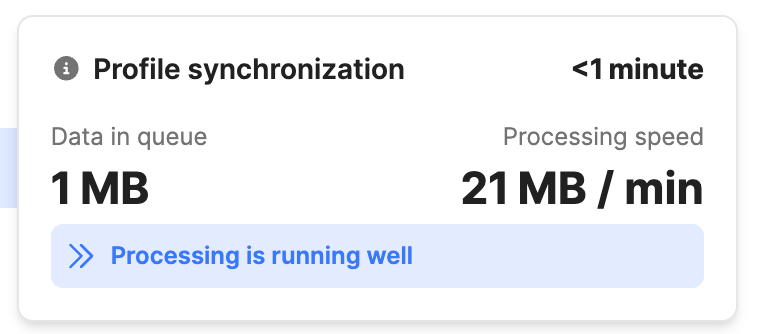
The final stage of the pipeline is Profile Synchronization. Once profile attributes have been recalculated, the updated profiles must be synchronized with the search index.
This synchronization ensures that the most recent profile data is available for segmentation, targeting, and activation workflows.
- The Data in queue value shows how much data is waiting to be synchronized.
- The Processing speed value shows how much data is being synchronized per minute.
When synchronization is complete, updated profile data becomes available for segmentation and campaign execution.
Status Indicators
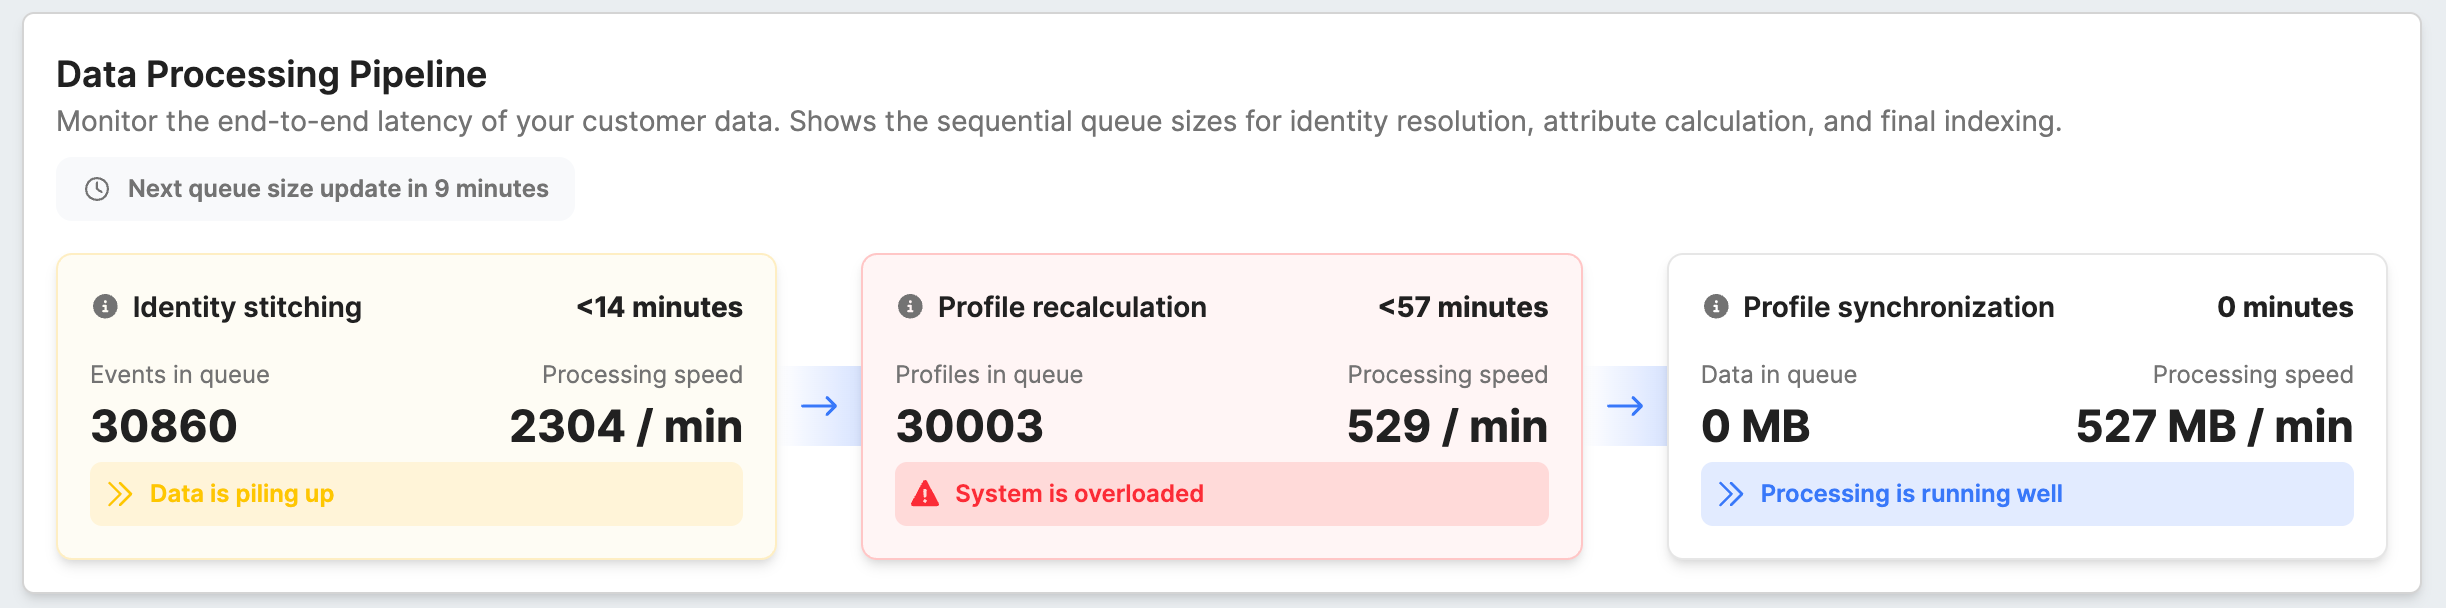
Each pipeline card displays a status badge that helps you quickly understand whether processing in that stage is running normally or whether delays are building up.
The status is based on estimated waiting time (ETA), not only on queue size.
In simple terms, ETA answers this question: “If processing continues at the current speed, how long will it take to clear what is waiting now?”
To estimate this time, the system looks at:
- how much data is currently waiting in the queue
- how quickly that stage is currently processing data
Because of this, a larger queue does not always mean a problem. If processing speed is high, ETA can still be low.
Likewise, even a smaller queue can become a warning if processing speed is very low.
The following statuses can appear on the Diagnostics page:
| Status | ETA (estimated waiting time) | What it means |
|---|---|---|
| Processing is running well | 0–10 minutes | Processing is keeping up with incoming data. This is the expected state in normal operation. |
| Data is piling up | More than 10 minutes (up to 30 minutes) | The stage is starting to fall behind. This can happen during short traffic spikes, larger imports, or temporary load. If this status remains for longer, data updates may become delayed. |
| System is overloaded | More than 30 minutes | The backlog is high enough that processing is no longer keeping up in that stage. Data may take noticeably longer to appear in the platform. If this status continues, further investigation is recommended. |
ETA shown in the card is displayed in a user-friendly way:
- 0 minutes when there is nothing waiting
- <1 minute for very short delays
- <X minutes for minute-based delays (for example, <12 minutes, <31 minutes)
- <X hours for longer delays (for example, <4 hours)
These status indicators are intended to provide a quick visual summary of system health. A temporary warning does not always mean there is a system issue. Short-term fluctuations are normal. If warning or overloaded status continues over time, review the Diagnostics page in more detail and check the Error Log for related issues.
Queue Update Information
Above the pipeline, you will see a message indicating when the queue size values will be updated.
For example, the system may display a message such as “Next queue size update in 4 minutes.” Queue size values are refreshed every 10 minutes, and this message shows how much time remains until the next update starts.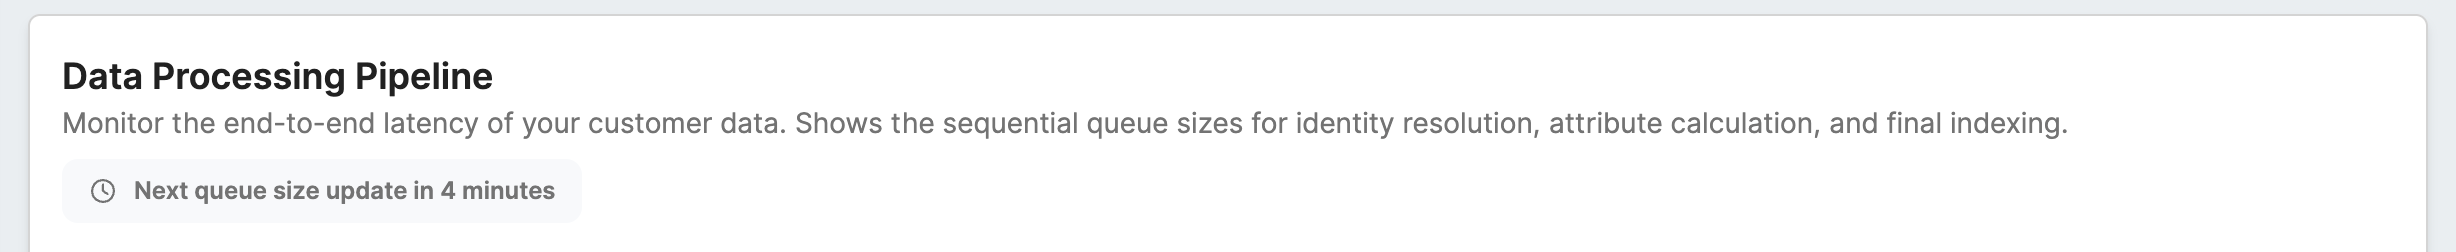
To correctly interpret the data on this page, it is important to understand that not all metrics are updated at the same time:
| Metric | How often it updates | What it shows |
|---|---|---|
| Queue size | Every 10 minutes | The number of events or profiles currently waiting to be processed in each stage. This value remains the same until the next scheduled update. |
| Processing speed | Continuously (approximately every 30 seconds) | How fast the system is processing data over time. This value is calculated as an average over a longer period, which makes it stable and less affected by short spikes. |
Because these two metrics are updated differently, their values may temporarily appear inconsistent. For example, the queue size may stay the same while the processing speed continues to change.
During the queue update process, the message may temporarily change to “Queue size update is running.”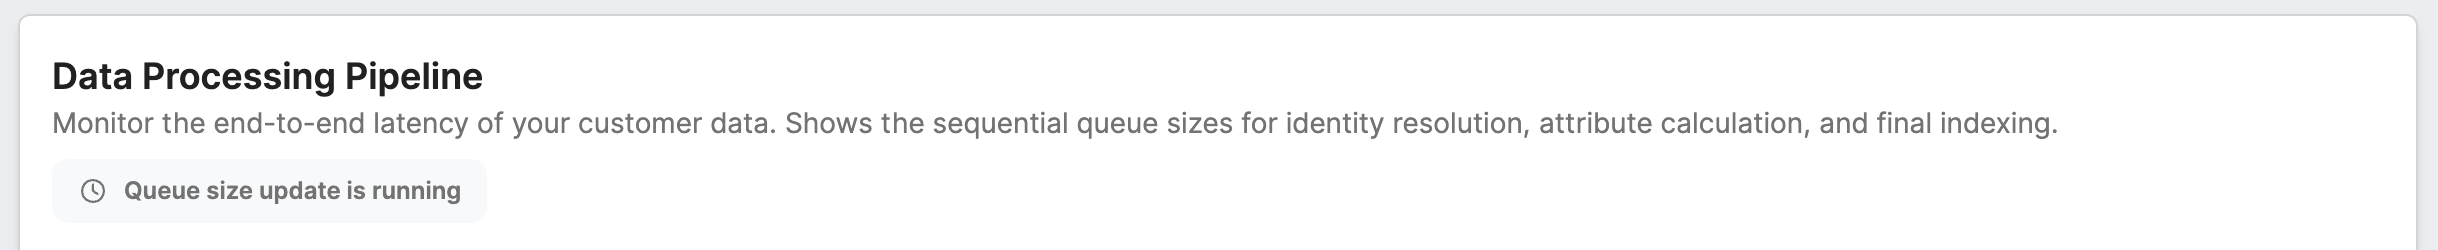
This behavior is expected and does not indicate an issue. It simply reflects how and when each metric is refreshed.
Error Log
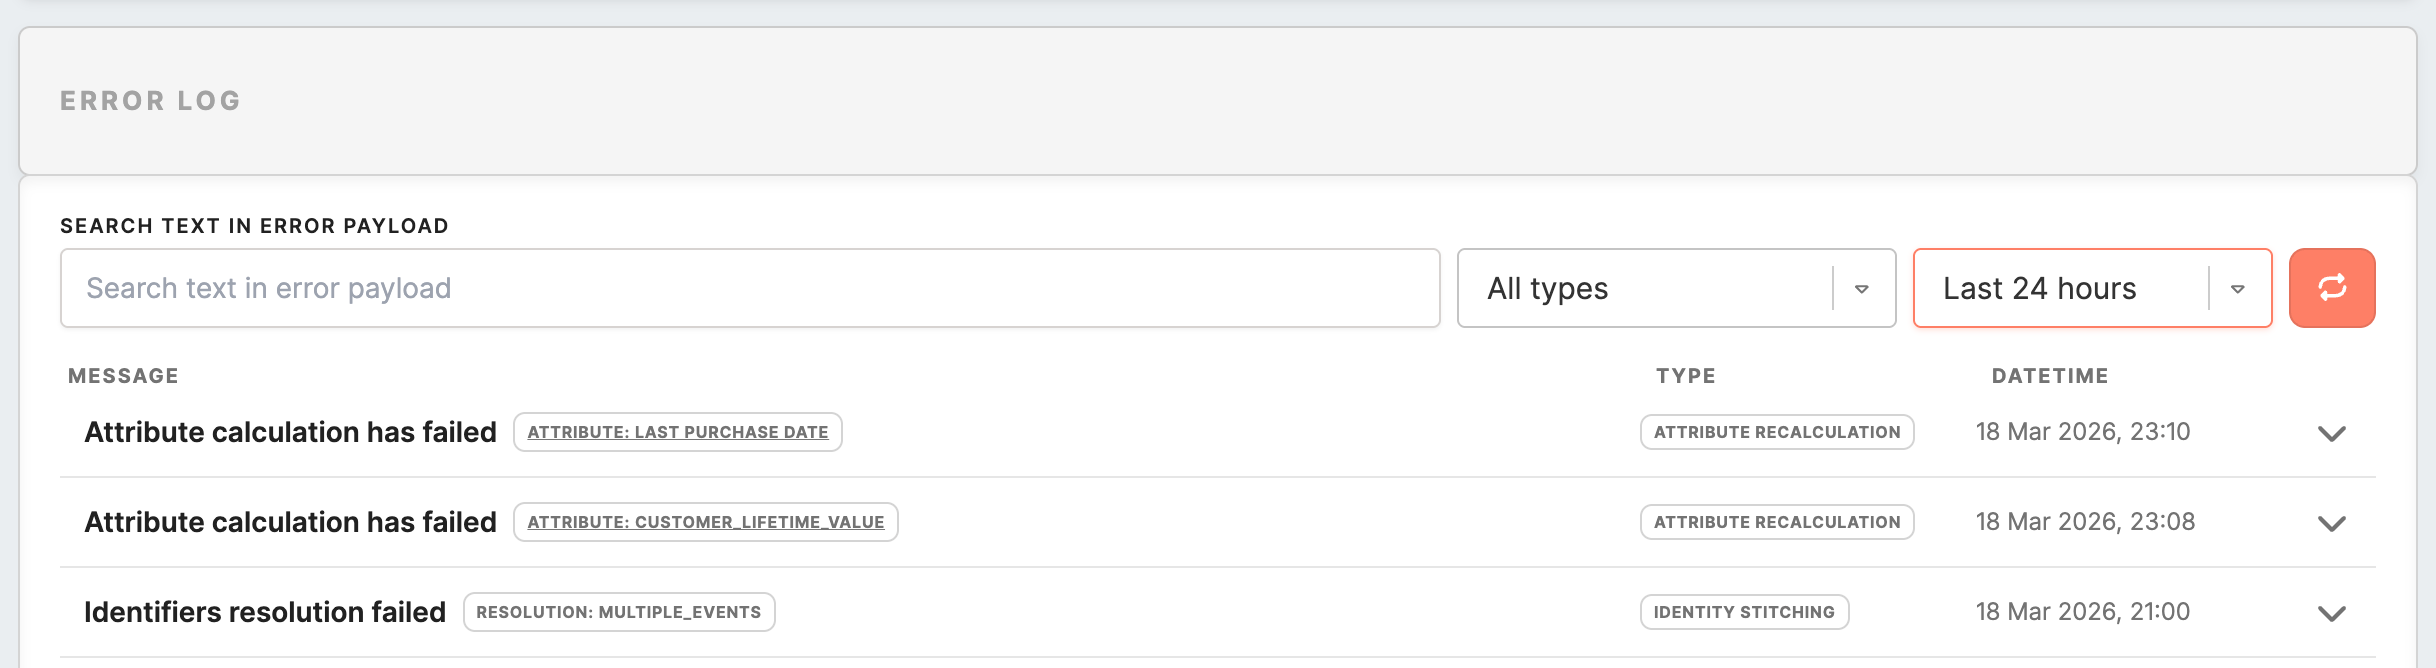
The lower section of the Diagnostics page contains the Error Log. This section lists processing errors that occurred while the system was handling events or recalculating profile attributes.
Errors can occur for various reasons, such as incorrect attribute definitions, unexpected data formats, or conflicts in identity resolution.
Each error entry contains a short description of the issue, the type of processing step where the error occurred, and the time when the error was recorded.
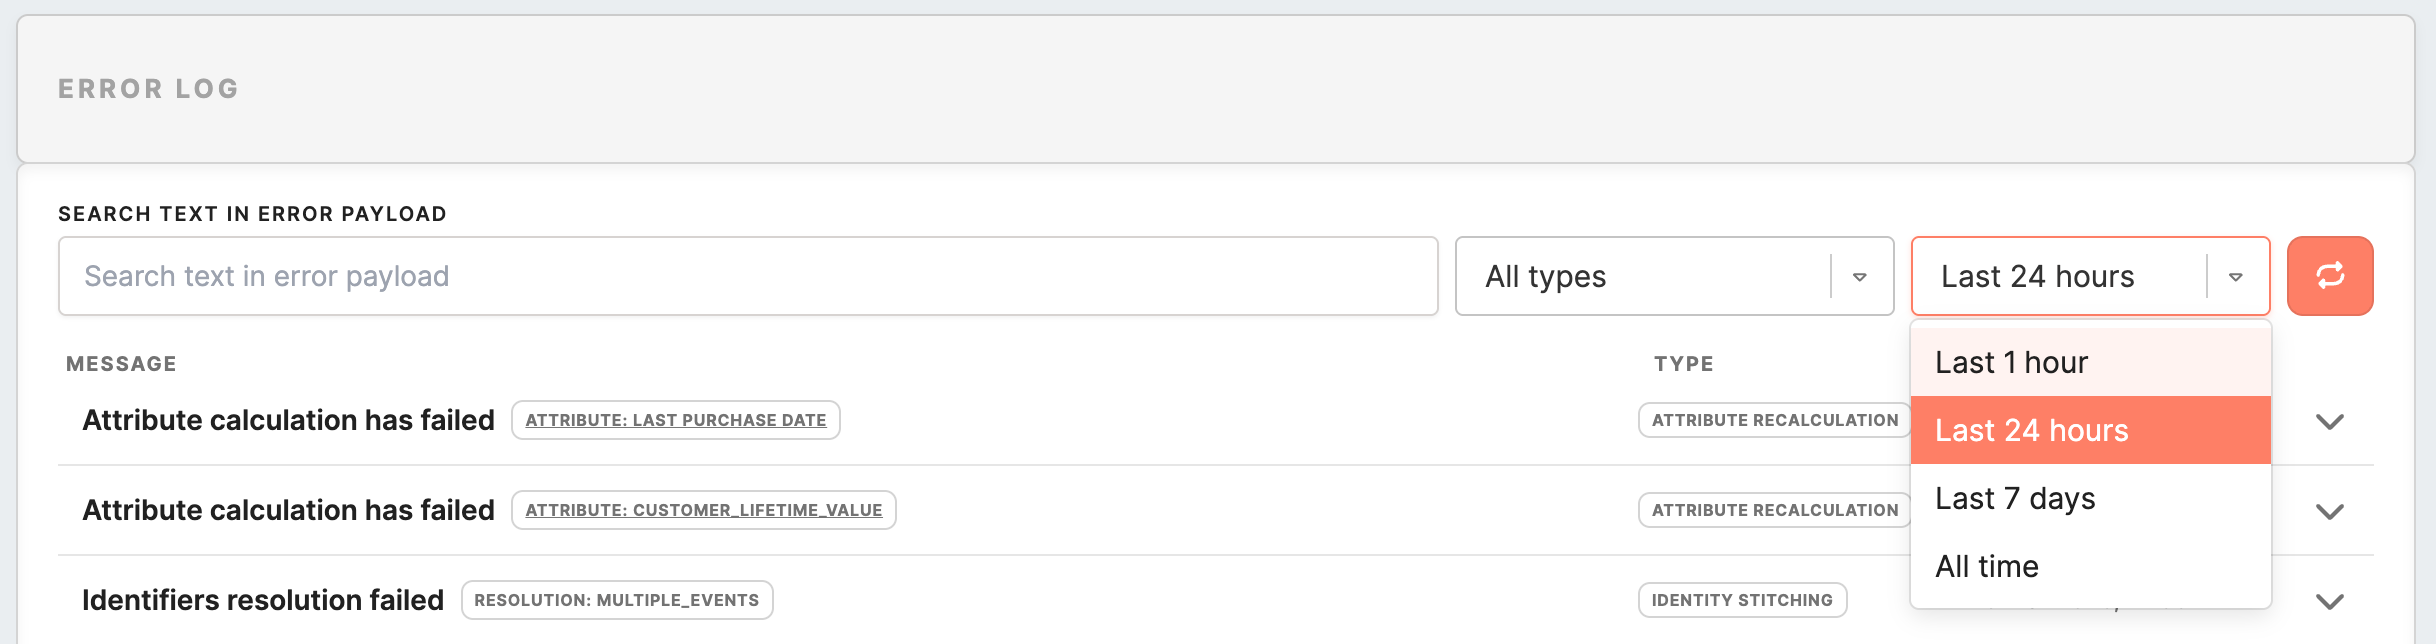
Filtering Errors
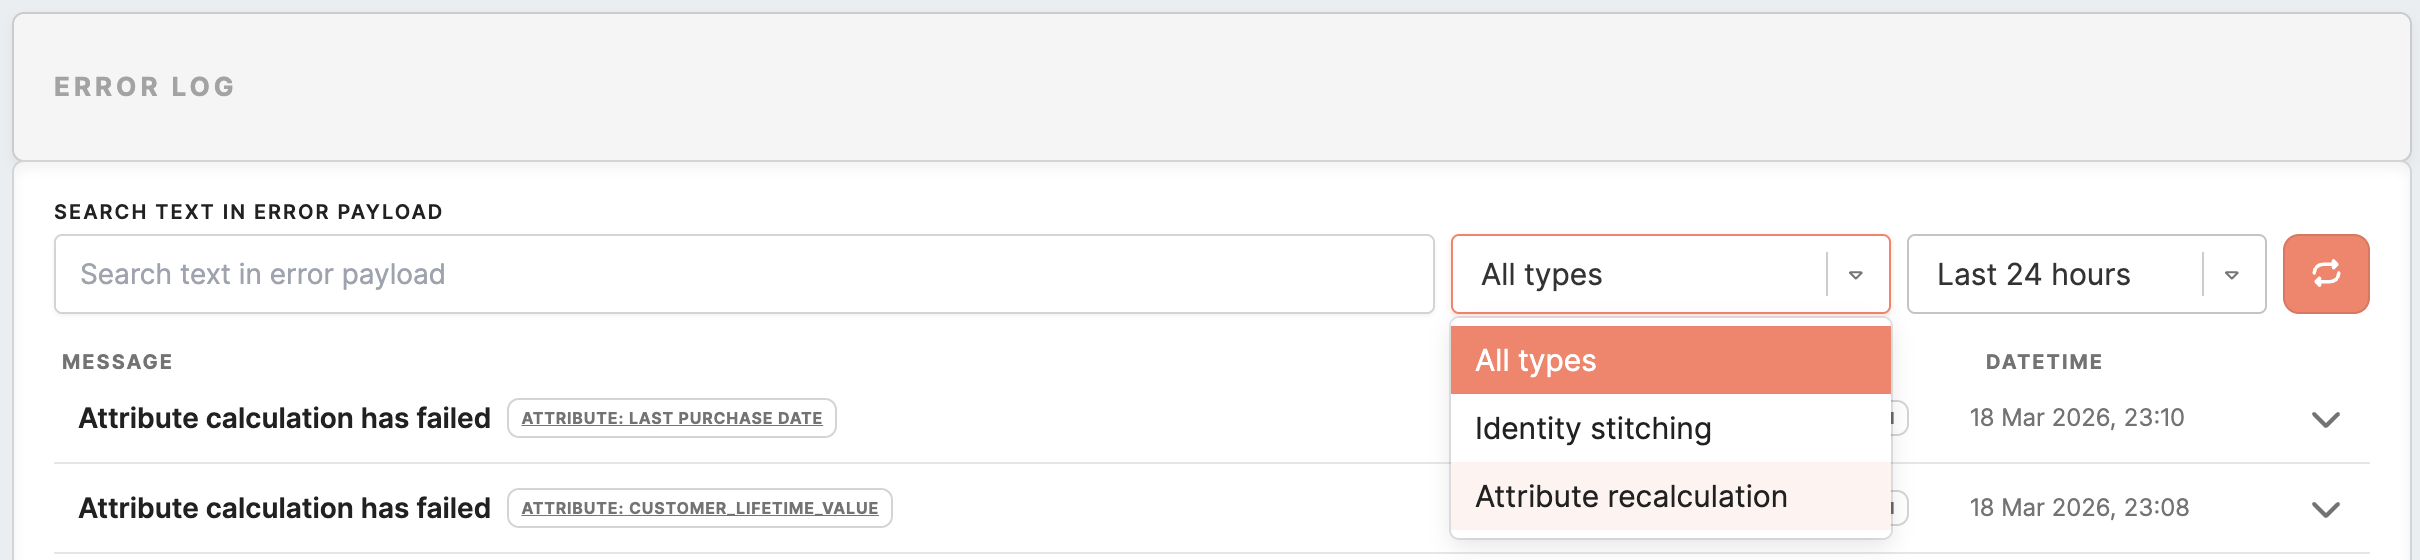
You can use the filtering controls above the error list to locate specific errors.
The search field allows you to search for errors by keyword or message content. To perform a search, you must enter at least three characters.
You can also filter errors by type, which allows you to view only errors related to identity stitching or attribute recalculation.
The time range filter allows you to limit results to specific time periods, such as the last hour, last 24 hours, or the last 7 days.
Viewing Error Details
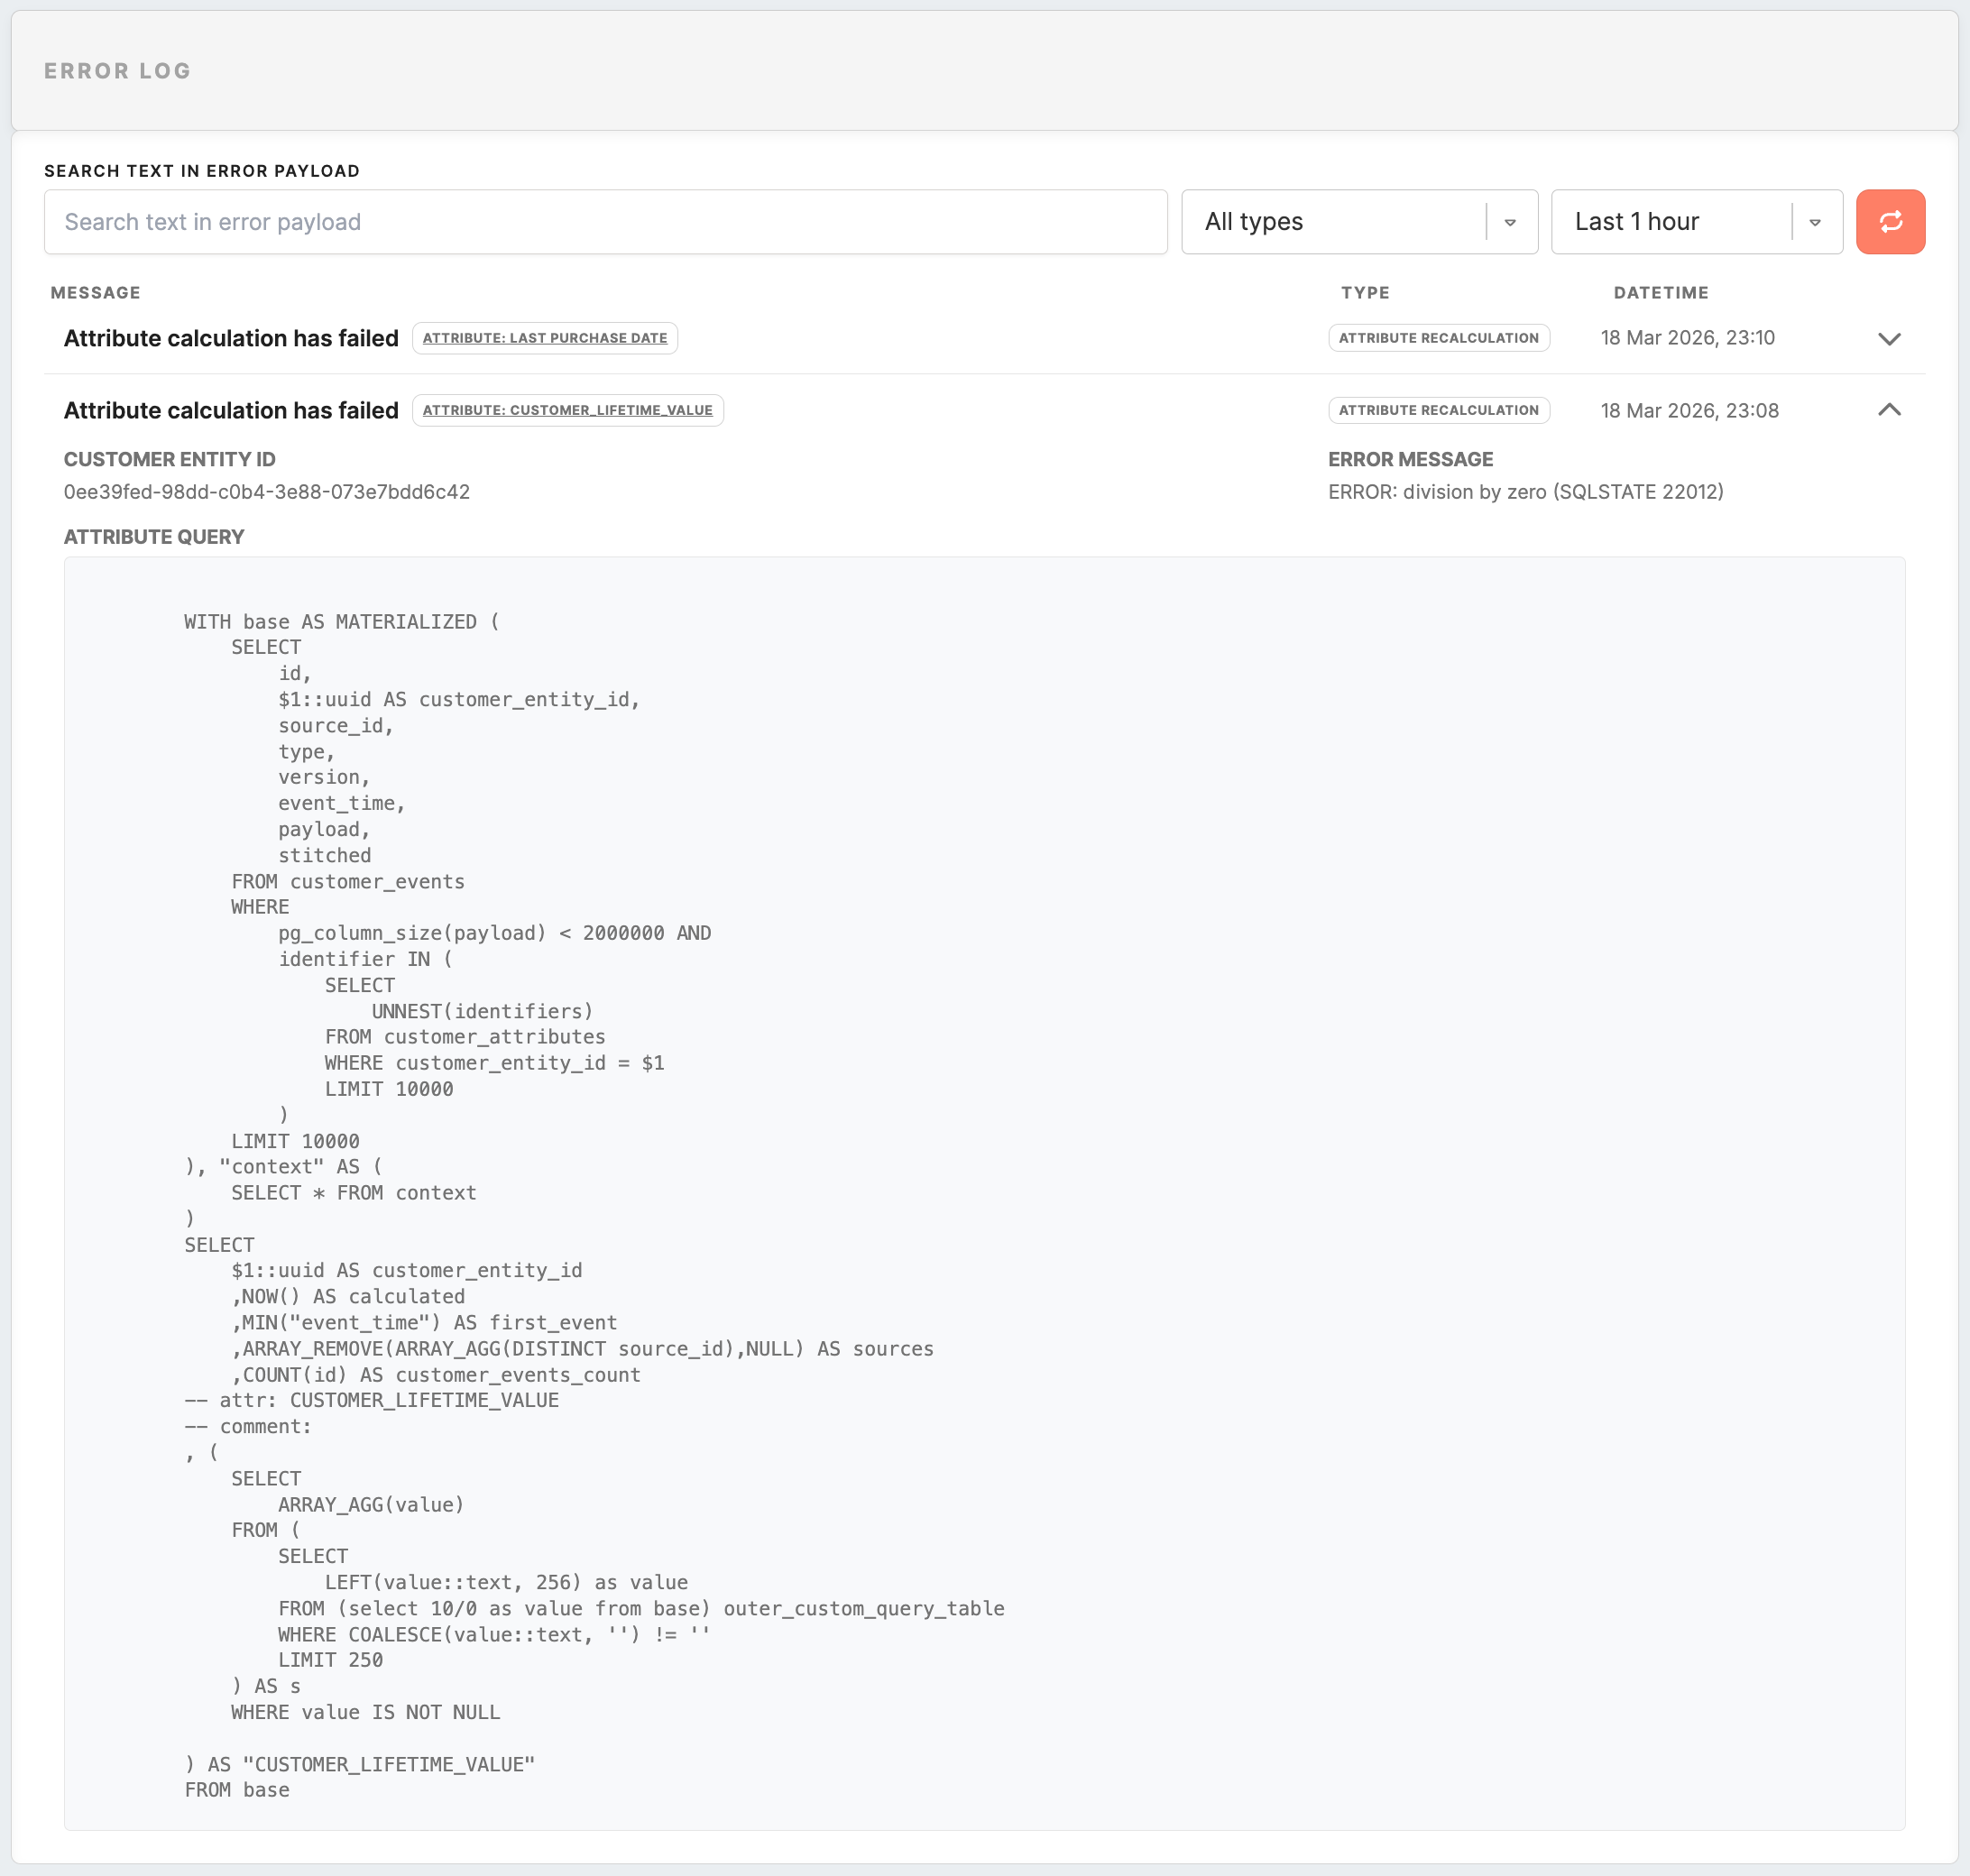
Each error row can be expanded to view additional information about the issue.
When expanded, the system displays the detailed context of the error, including the related customer entity ID, attribute information when applicable, and the technical data used by the system during processing.
This information helps administrators understand the root cause of the issue and identify potential configuration problems.
When to Use the Diagnostics Page
The Diagnostics page is particularly useful when investigating delays in data updates or troubleshooting processing issues.
If segments are not updating as expected, campaign targeting appears outdated, or profile attributes seem incorrect, this page can help you determine whether the system is processing data normally or experiencing errors.
By monitoring queue sizes, processing speeds, and error logs, administrators can quickly identify potential issues and ensure that customer data is processed reliably.
Frequently Asked Questions
| Question | Answer |
|---|---|
| Why is the queue not zero? | A non-zero queue is normal. Customer data is constantly entering the system, and processing happens continuously in the background. A small queue simply means items are waiting to be processed. |
| The queue size has not changed in a while. Is something wrong? | Not necessarily. Queue size values are refreshed every 10 minutes. If the same number appears across multiple updates and processing speed is also very low or zero, it may be worth investigating further. |
| Why does the processing speed change so often? | Processing speed is updated more frequently and represents an average over time. It may fluctuate depending on incoming data volume, system load, and the complexity of calculations. Small changes are expected. |
| Why is processing speed changing while the queue size stays the same? | This is expected. Queue size updates every 10 minutes, while processing speed updates more frequently. Because of this, the two values may temporarily appear out of sync. |
| A card shows “System is overloaded”. What does that mean? | This means the queue has grown beyond 50,000 items. The system is no longer keeping up with incoming data, and processing delays are likely. |
| What should I do if a card shows “System is overloaded”? | This can happen during large imports or high traffic. If the status does not return to normal after some time, check the Error Log and contact your technical team or Meiro support. |
| Does a high queue always mean there is a problem? | No. Temporary increases are normal, especially during busy periods. It becomes a concern if the queue continues to grow or stays high for a long time. |
| What does “Profiles are piling up” mean? | This indicates that the queue is growing beyond the normal range, but processing is still ongoing. It is a warning that delays may occur if the trend continues. |
| Why can processing speed be zero even when there are items in the queue? | Because processing speed is calculated as an average, it may temporarily show zero even when data is being processed. However, if it remains zero for a longer time while the queue is high, it may indicate an issue. |
| Why are my latest data changes not visible yet? | Your data may still be in one of the processing stages. Updates become available only after passing through all stages of the pipeline. |
| When should I check the Error Log? | Check the Error Log when queues remain high, processing seems delayed, or data is not updating as expected. |
| What kind of errors can appear in the Error Log? | Errors may be related to identity stitching, attribute recalculation, or other processing steps. They help identify issues affecting data processing. |
How to Interpret the Numbers
The numbers displayed in the pipeline cards represent the current workload of the system and the speed at which that workload is being processed. Understanding how these values relate to each other helps determine whether the system is operating normally or whether processing delays may occur.
The queue size shows how many items are currently waiting to be processed at a particular stage. In the Identity Stitching stage, this refers to incoming events that have not yet been matched with a customer profile. In later stages, the queue represents profiles waiting for recalculation or synchronization.
The processing speed indicates how many items the system is able to process per minute at that stage. This value reflects the current throughput of the processing engine.
These two numbers should always be interpreted together. A large queue does not necessarily indicate a problem if the processing speed is high and the queue is being cleared quickly. For example, a queue of several thousand events may still be processed rapidly if the system is handling hundreds of events per minute.
On the other hand, if the queue continues to grow while the processing speed remains low or unchanged, this may indicate that the system is temporarily processing a backlog. In such cases, the queue may take longer to clear, and updated data may appear in the system with a delay.
The Diagnostics page may also display an estimated processing delay, which indicates approximately how long it may take to clear the current queue. This estimate is calculated using the current queue size and the current processing speed. Because both of these values change over time, the estimated delay is only an approximation and may fluctuate as the system processes new data.
It is also important to remember that short increases in queue size are normal. For example, when large batches of events are received or when many profiles are updated at once, queues may temporarily increase before returning to normal levels.
Monitoring how queues behave over time provides the best indication of whether the system is operating normally.
Common Situations and What They Mean
In most cases, the Diagnostics page reflects normal processing activity. However, certain patterns in the displayed metrics can help explain why data updates may appear delayed.
One common situation occurs when the Identity Stitching queue increases temporarily. This typically happens when the system receives a large number of events in a short period of time, such as during peak traffic on a website or during data imports. In these situations, the queue may increase briefly before the system processes the backlog and returns to normal levels.
Another situation occurs when the Profile Recalculation queue grows significantly. This can happen when incoming events trigger recalculation for a large number of profiles. For example, if many users perform actions that affect calculated attributes, the system may need to update thousands of profiles. While this process runs, the recalculation queue may temporarily grow before being processed.
Sometimes the Profile Synchronization queue increases. This means that updated profiles are waiting to be synchronized with the search index used for segmentation and activation. During this time, the most recent updates may not yet be visible in segments or campaign targeting until synchronization completes.
Occasionally, administrators may notice that queues remain large for longer periods of time. If this occurs together with repeated errors in the Error Log, it may indicate that a configuration issue, such as an incorrect attribute definition, is preventing some processing steps from completing successfully.
Another possible situation is when processing speed appears to be very low or temporarily zero. This does not always mean that the system has stopped processing. Processing speeds are calculated based on recent activity, so short periods without processing may cause the displayed speed to drop temporarily. If queues continue to decrease while the speed value fluctuates, the system is likely still processing data.
If queues continue to grow without decreasing over time, or if the Error Log shows repeated failures, it is recommended to review the configuration of recently added attributes or data sources, or to contact support for further investigation.
Understanding these patterns helps administrators determine whether the system is functioning normally or whether additional investigation may be required.
No Comments