Meiro Analytics
Meiro Analytics is a solution for reporting the success of Meiro use cases. Instead of calculating the data from attributes, it takes values directly from events and calculates from there. It utilises the HyperLogLog (HLL) algorithm, which solves the count-distinct problem by approximating the number of distinct elements instead of trying to calculate them precisely. Link to the complete HLL reference doc on GitHub.
Meiro Analytics itself is a Python script saved in the GitHub repository. We use it via a Python from Git Repository processor and fill all the necessary parameters in its config. It transports events from Cockroach DB into staging tables along with event times and customer entity IDs into reporting DB and goes through a series of Postgres queries specified in the parameters of the configuration. It does not work with any Data In/Out.
Prerequisites
Meiro Analytics stores the aggregated data in a reporting database, separate from your CDP instance.
Please inform the Meiro team to have this database set up before running your Meiro Analytics component.
Parameters
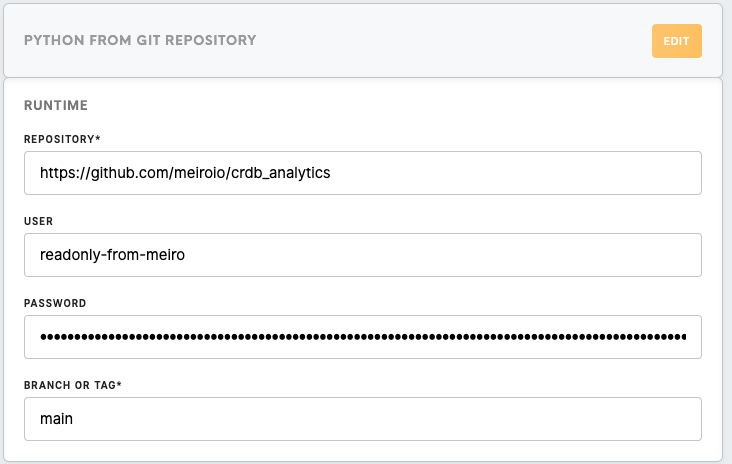
| Repository | Always use https://github.com/meiroio/crdb_analytics, where the component lives. |
| User | Use a login that can read the above-mentioned repository. readonly-from-meiro can be found in 1Password and works well for this purpose. |
| Password | Password for the above specified Github account. |
| Branch or Tag | Unless specified otherwise by the development team, use the main branch. |
Component Setup
All other parameters need to be specified in the code editor in JSON format.
| src |
Cockroach credentials of the instance need to be inserted here. The component will use them to connect to the events table and download specified events for further processing. |
| dst |
Credentials to reporting the DB of the instance need to be inserted here. These are generally unavailable to users, so please contact the Meiro team to get these filled in. |
| skip_events_transport |
Every component run drops all staging tables in the reporting DB and creates new ones. If we are building queries and testing, we can skip this by setting this to true and work with data from the previous run. Always set this to false to enable events transport for live deployment.
Remember: If we run the component for the first time or add new events, we need to make at least one run with events transport enabled to ensure we have data to work with. |
| events_since |
Specify how far into the past are we looking with an integer. The component will then process data that number of days before the current date. |
| events_since_now |
For live deployment, always leave this empty. For backloading purposes, we can specify a date in |
| events |
Here we specify what events we want to transport from the CR events table. First, we specify an event_id from the CR events table, and then we choose a name for the staging table into which we will load these events. For example, |
| events_since_type |
If we need to make an exception from the events_since rule for specific events, we can do so here. This can help us to prevent loading and calculating with needlessly large amounts of data. Example: |
| analytics: transforms |
The transforms section of the analytics field serves to specify transformations in the |
| analytics: reports |
Tables created in this part of the config are created in the |
Warning: When setting up various values in events_since, events_since_now, and events_since_type make sure that there are events in CR for the days that will be loaded! In cases with short event retention, you can ruin your reports by trying to load days without events, which will cause the incremental nature of loading to load empty data.
{
  "src": {
    "host": "CR host of the instance",
    "port": "CR port",
    "user": "general CR user of the instance",
    "#pass": "password of the user",
    "db": "database name of the instance"
  },
  "dst": {
    "host": "host of reporting DB for the instance",
    "port": "port of the reporting DB",
    "user": "user of the reporing DB",
    "#pass": "password of the user",
    "db": "reporting"
  },
  "skip_events_transport": boolean,
  "events_since": "integer",
  "events_since_now": "empty or YYYY-MM-DD",
  "events": {
    "event_id1": "table_name1",
    "event_id2": "table_name2",
    "event_id3": "table_name3"
  },
  "events_since_type": {
    "event_id1": integer,
    "event_id2": integer
  },
  "analytics": {
    "transforms": [
      {
        "transform1": "query1; create index on analytics_staging.transform1 (column1);"
      },
      {
        "transform2": "query2; create index on analytics_staging.transform2 (column1);"
      },
      {
        "transform3": "query3;"
      }
    ],
    "reports": {
      "se_campaigns_emails": {
        "base": "select * from transform1",
        "dimensions": {
          "dimension1": "COALESCE(column1, '')",
          "dimension2": "COALESCE(column2, '')"
        },
        "metrics": {
          "metric1": {
            "data_type": "INT",
            "definition": "COUNT(*) FILTER (WHERE column2 = 'type1')"
          },
          "metric2": {
            "data_type": "INT",
            "definition": "SUM(value) FILTER (WHERE column2 = 'type2')"
          },
          "metric1_entity": {
            "data_type": "hll",
            "definition": "hll_add_agg(hll_hash_text(customer_entity_id::text)) FILTER (WHERE column2 = 'type1')"
          },
          "metric2_entity": {
            "data_type": "hll",
            "definition": "hll_add_agg(hll_hash_bytea(decode(replace(customer_entity_id::text, '-', ''), 'base64'))) FILTER (WHERE column2 = 'type2')"
          }
        },
        "filter": ""
      }
    }
  }
}
Metabase
Further steps are made in Metabase, where we again need to reach out to Jan or create a Jira ticket in #help_it Slack channel to have it connected to the reporting DB. Then we can start writing queries into our tables defined in analztics"reports section of the config. The basic function to work with the HLL aggregated values is hll_cardinality(hll_union_agg(metric)). More advanced methods can be researched if needed.
Troubleshooting
It is a good practice to watch the logs - the component lists the steps as it is going through them. A SQL error will always be displayed and will be related to the last query listed.
Take care of run times - if the component spends too much time loading events, perhaps fewer events could be loaded. If a query takes too long, maybe it could be simplified or the source tables better indexed.
No Comments