Connector Adobe Analytics
Adobe Analytics is a robust web analytics platform developed by Adobe Systems, designed to help businesses analyze and interpret user behavior across various digital channels. It provides comprehensive insights into website and app performance, offering data on user interactions, conversions, and engagement metrics.
By seamlessly integrating Adobe Analytics with a CDP, businesses can unify data from multiple touchpoints, such as websites, mobile apps, and marketing campaigns. This integration enables the creation of a unified customer profile, facilitating more targeted and personalized marketing strategies based on the rich behavioral data collected by Adobe Analytics.
Learn more: about Adobe Analytics please refer to this article.
Setting up the connector in MI
Requirements
The credentials of the Adobe Analytics you would like to connect to:
You should get them from the administrator of the Adobe Analytics account or your client.
Features
Adobe Analytics connector is built on the base of Adobe Analytics v.1.4 API.
Metric
A metric is a structure that specifies the type of event data captured in the report such as views, click-throughs, reloads, average time spent, units, orders, and revenue. You can learn more about the metric below in the Parameters section.
Element
An element is a structure that further breaks down (organizes) the report's metrics data. You can learn more about the elements below in the Parameters section.
Data In/Data Out
|
Data In |
N/A |
|
Data Out |
Your results will be saved as a JSON file in the Data Out bucket |
Learn more: about the folder structure please go to this article.
To work with the data, you may use a processor to transform JSON data to a CSV file using the JSON to CSV processor. Depending on the data structure, your query would look different, and therefore, there is no one way of doing it. In case of trouble, please contact Meiro's team to assist you.
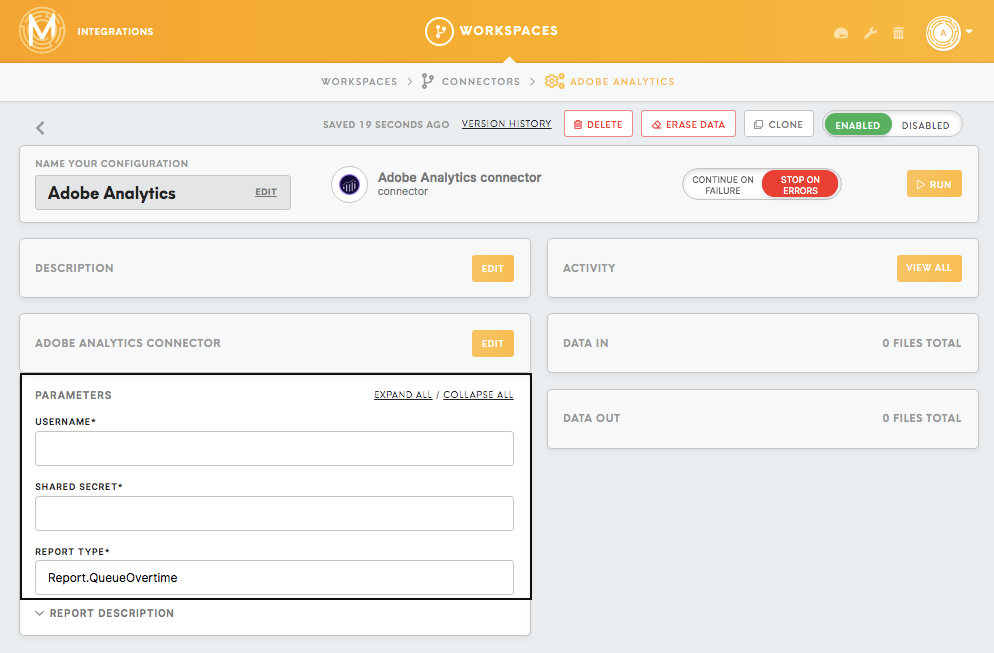
Parameters
|
Username (required) |
The username that you should get from the administrator of the Adobe Analytics account or your client. |
|
Shared Secret (a piece of data, known only to the parties involved) for Adobe Analytics account. You should get them from the administrator of the Adobe Analytics account or your client. |
|
|
Report Type (required) |
Learn more: about report types, please refer to the Analytics Reporting API and Reporting API Tutorial. |
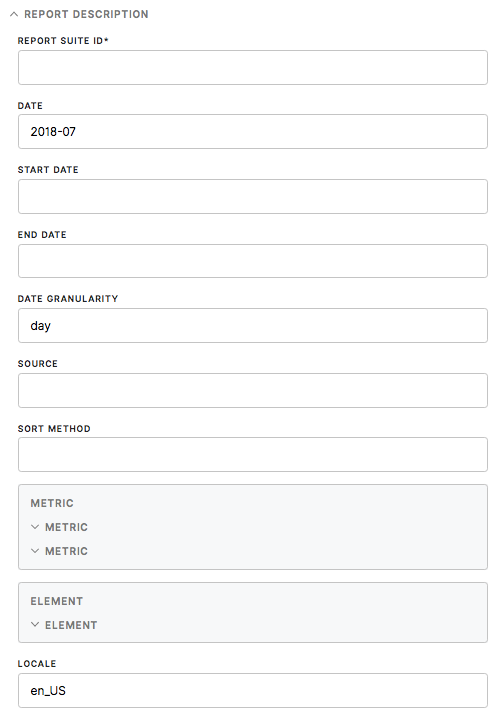
Report Description
|
Report Suite ID (required) |
You will need a Report Suite ID to generate the report. You should be able to get this ID from the Adobe Analytics account administrator or your client. |
|
Date/Start Date/ End Date (optional) |
The Date field is for when you want to specify a date that you want the run the report. If you’re using this field Date, then leave the Start Date and End Date fields alone. Start Date is the starting date used to run the report when using a data range. End Date is the ending date used to run the report when using a data range. Warning: When using Start Date/End Date, do not use Date. The Date format for this field is also `YYYY-MM-DD` (4 digit year, 2 digit month, and 2 digit day), and the month and day designators are optional. For example: `”date”: "2009-01-15"`. Due to specific system requirements, the minimum date that can be used in the Date, Start Date, and End Date parameters is 2000-01-01, and the maximum date is 2899-12-31. Requesting a date outside of this range results in an error. Requesting an End Date that is earlier than the Start Date will also result in an error. Warning: If the date parameter(s) are not included, the current day is used by default. Remember: Real-time reports also support relative dates. You can use the parse DateTime library as well. |
| Date Granularity (optional) |
The Date Granularity specifies the level of time-based detail that is included in the report. Valid values are seconds, hour, day, week, month, quarter, year. The time units are used to display data in a report that organizes the data by date (e.g. an Overtime report). For example: `"dateGranularity": "day"` Learn more: about granularity, please refer to and the Adobe documentation. |
|
Source (optional) |
This field value for this is defined as ‘standard’ by default. If you want to generate a real-time report, then simply specify it as ‘realtime’. For example: `"source": "realtime"` Learn more: about sources, please refer to the Adobe documentation. |
|
Sort Method (optional) |
This Real-Time Report sort method is used only when 'Source' is set to 'realtime'. One example in using the Sort Method field: using `"sortMethod": "algorithm"` to return the most popular events. Learn more: about the sort method options, please refer to the table in the Adobe documentation. |
|
Metric ID (required) |
You will need a Metric ID in order to generate an array of the metrics that you want to include in the report. A metric is a structure that specifies the type of event data captured in the report, such as views, click-throughs, reloads, average time spent, units, orders, and revenue. A report must specify at least one metric (Ranked/Overtime reports support one or more metrics. Trended reports support only one metric.) For example: `"metrics": [ {"id": "pageViews" }, {"id": "visits"}]` Warning: If the list of metrics is left empty, the default metric "pageviews" is used. Learn more: about metrics, please refer to the Adobe documentation, as well as reporting APIs |
| Element ID (required) |
An element is a structure that further breaks down (organizes) the report's metrics data. For instance, you can generate a report that breaks down page views (metric) by a browser (element). For example: `"elements": [{"id": "trackingCode"}]` Warning: A report may have a maximum number of three elements. Warning: Elements have restrictions on which other elements they can be combined with within a report. Learn more: about possible elements in the Adobe documentation.
|
|
Locale (optional) |
This field allows you to specify the language you want the report data to be displayed in as well as in which geographic location you want to run the report. For example: `en_US`, refers to English (United States). Learn more: about the available locale, please refer to the Adobe documentation. |
No Comments