Step-by-step guide for creating reports in Metabase
To create custom reporting in Metabase, it is necessary to configure processes in Meiro Integration and Meiro CDP. In Meiro Integration, define ETL processes for data preparation, and in Meiro CDP, manage and export data to Metabase, creating a connection between detailed customer information and analytical capabilities in Metabase.
Meiro Integration (MI)
When aiming to integrate efficient reporting into your enterprise environment, the crucial first step is to create a workspace along with an appropriate script. This script will serve to define tables with calculated values, which will be subsequently utilized in Metabase for creating metrics and queries.
1. Creating Workspace and Script
Create a workspace containing a script where you set up the desired tables and their values. It is also crucial to define events, dimensions, and metrics that will serve as starting points for analysis. This script will process only needed event data from the CDP incrementally and aggregate the data based on the configuration - thus reducing the load on the actual CDP database and reducing the data volume needed for reporting.
Learn more: for a detailed procedure and a practical script example, visit the official documentation at Meiro Analytics.
2. Configuring Metabase and Calculating Values
After successfully completing all the steps from the mentioned article, your workspace will be ready to generate tables in Metabase. It is optimal to set a regular schedule, such as every hour; however, this frequency depends on the volume of data to be calculated. After the initial configuration run, it will be possible to evaluate the runtime and adjust the schedule accordingly.
In conclusion, the implementation of this process enables the efficient and regular generation of necessary data for Metabase, providing users with up-to-date and relevant information.
CDP - Metabase
As a first step in the process, it is necessary to request your Project Manager to set up credentials in Metabase (handled by Meiro). Once Metabase is connected to the created script in MI and the database, we recommend checking if all created tables from Meiro Integration are being imported (Administration => Configuration => Reporting => Metabase). In the main menu, these tables can be found under Data => Browse data -> Meiro Analytics.
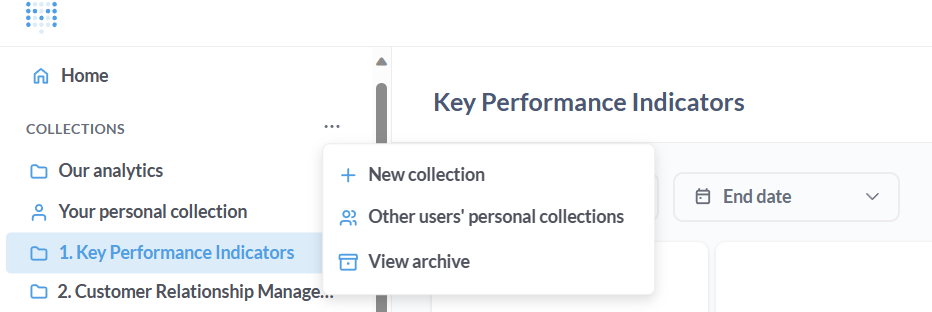
Once all the steps are completed, we create a collection in Metabase.
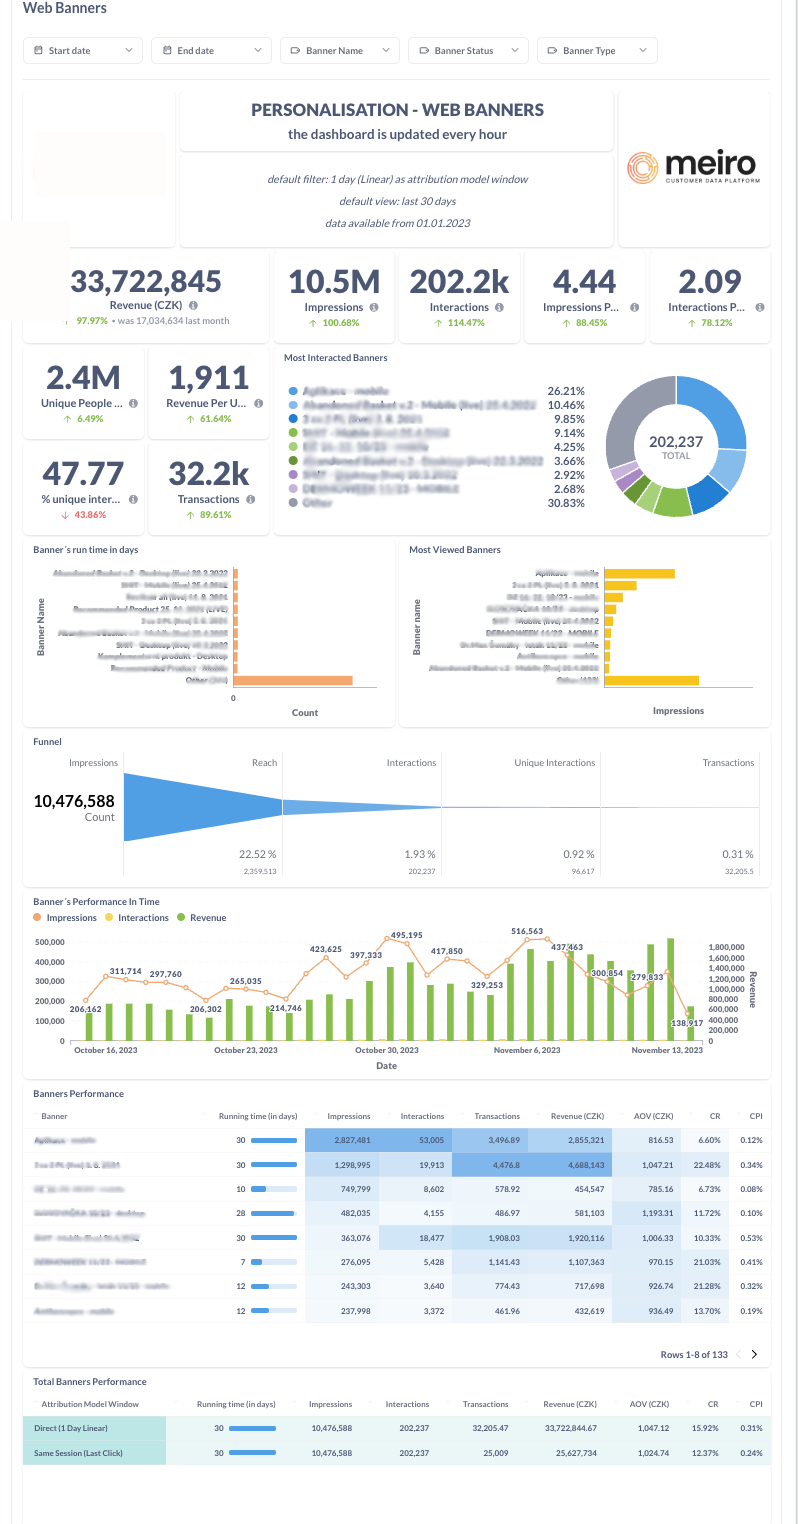
In this collection, we create individual metrics and a dashboard designed for visualizing these metrics (In Metabase, each metric/visualization is called a “Question”). Among the key indicators Meiro monitors on the web is the reporting on banner performance - Web: reporting on banner performance. Naturally, it is possible to customize the dashboard and visualizations according to individual preferences and track additional metrics that are crucial for the business.
Warnings: it is necessary to select a database for each of the metrics from which the data will be calculated - in our case, Meiro Analytics.
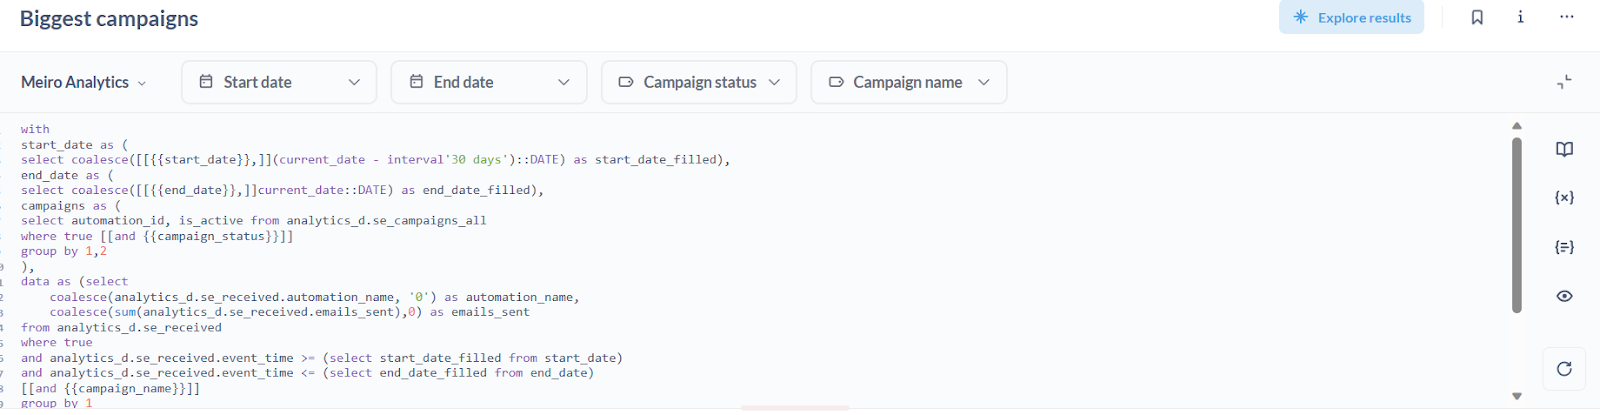
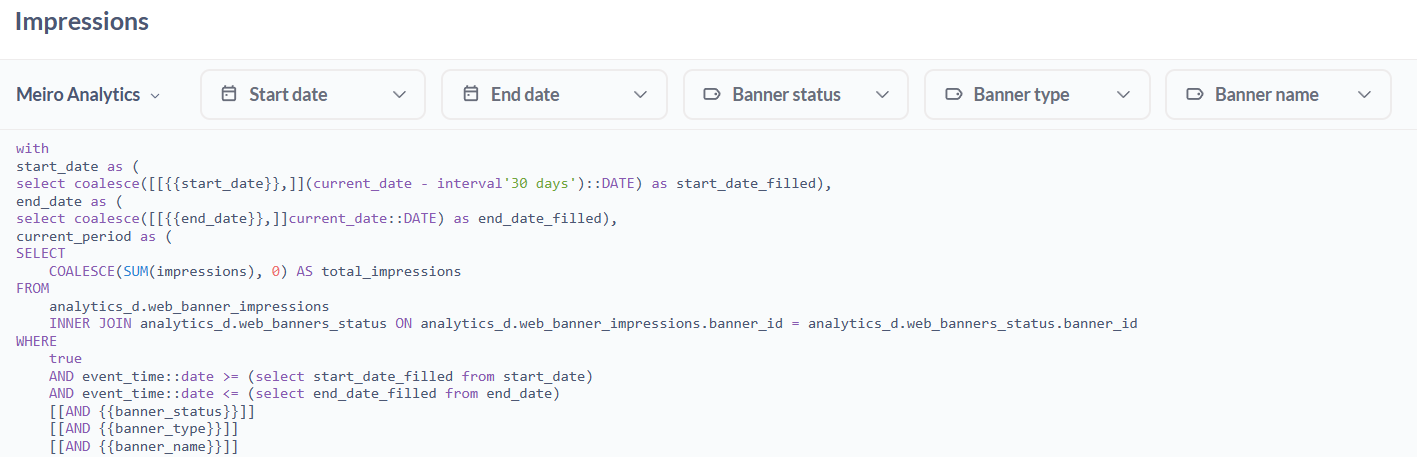
In each metric, filters can be applied, such as time periods, banner name, banner status (enabled, disabled), and banner type (native, pop-up) or custom.
However, it's crucial to ensure that this information is present in one of the tables created in Meiro Integration.
Without the correct existence of these details in the tables, creating such filters is not possible. The relationship between the variable in the query and the filter is established in the Variables section (see image), where we choose from which table this information will be derived. To know more about how to set up filters for SQL questions, check this documentation from Metabase
Example of a variable:
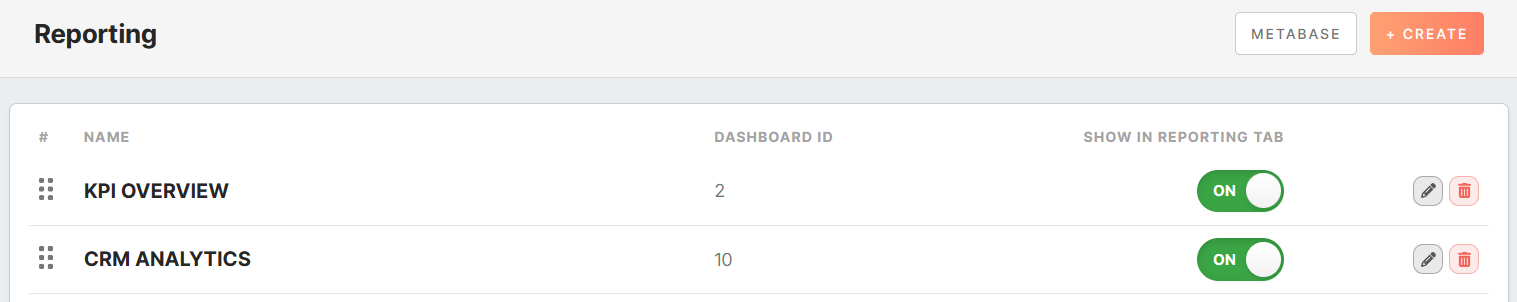
To make the dashboard visible in Reporting, you need to create the dashboard first. Go to Administration - Configuration - Reporting and click on the + CREATE button. Fill in the table name and assign it the Metabase Dashboard ID (visible in the URL of that specific dashboard).
No Comments