Best Practices for Insights Creation
This document contains all the best practices on insights creation on Meiro Business Explorer.
Grouping Similar Insights
Make use of the color selection to group similar insights together so that it is visually easier to locate certain insights. 
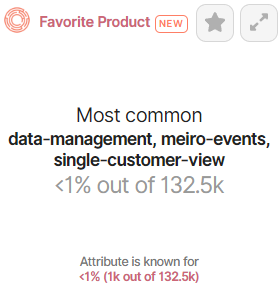
Unreadable Insights
When creating insights, the preview example for a pie chart display could show the numbers clearly but when reviewing it under Analytics > Insights tab, it will display multiple <1% bars instead. This is due to the data having multiple groups of people under different categories which amounts to <1% for each group.
Instead of using pie chart display, change it to list display

Multi-values Attribute
When using “Most Common” condition in a pie chart display, you might get the following visualization which adds up to more than 100%.
Example:
We have 3 customer profiles in a segment and we want to get an insight on the most common viewed page for that segment.
- Customer profile visited pages A and B
- Customer profile visited pages B and C
- Customer profile visited pages C and D
The percentage of customer profiles who viewed the pages could be as follows:
Page A: 66%
Page B: 66%
Page C: 66%
Page D: 66%
A single pie chart is unable to show the values of the multiple pages as a single entity can have more than one value hence the values are looped around the chart showing multiple values.
A better visualization method will be to use a list display.

Example Insights for Different Industries
|
Industry |
Example Insights |
|
Across all industries |
|
|
E-commerce |
|
|
Banking |
|
|
Publishing |
|
|
Real Estate |
|
No Comments