Tab: Data
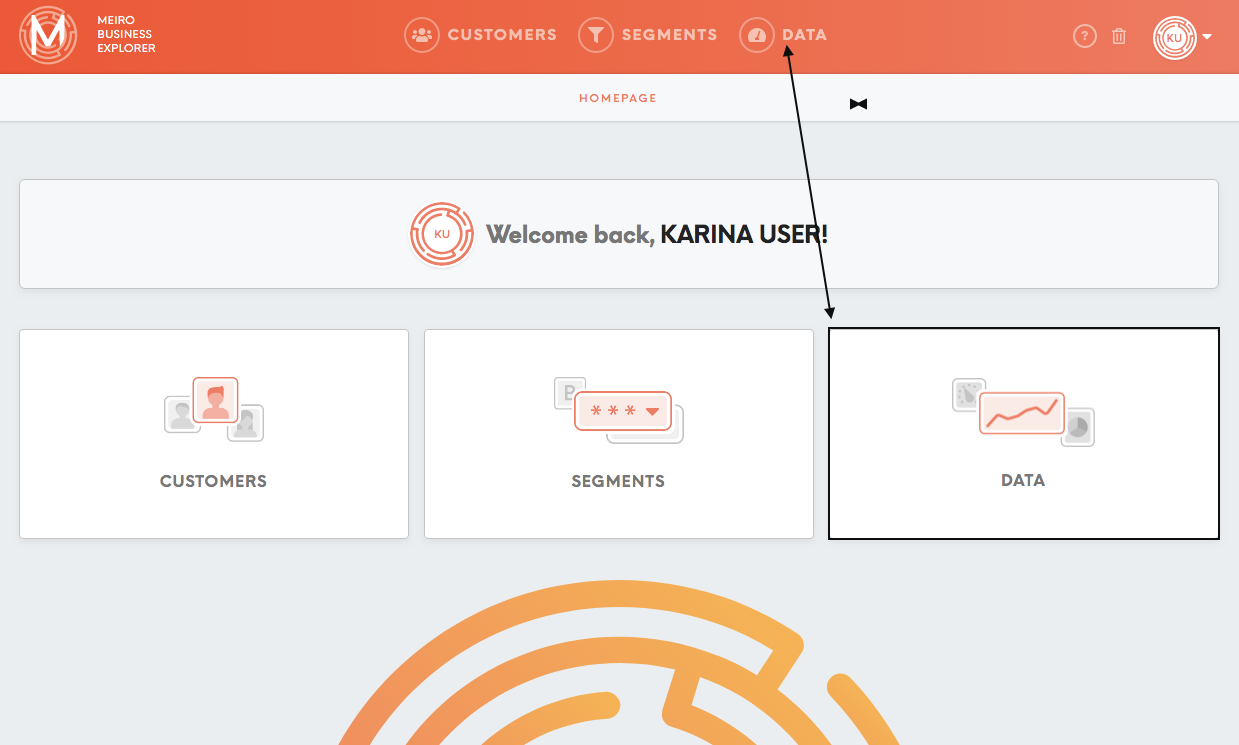
The Data tab summarises all the information about the available data:
Diagnostic Dashboard
It is easy to get lost in a vast amount of data. The Diagnostic Dashboard helps you to get a better understanding of the bigger picture and overall tendencies of customer behaviours.
Remember: As the Diagnostic Dashboard is hardcoded and it cannot be changed, its layout stays the same for the different projects. Only Number of Unique Customers Identified Across x Sources and Number of Customers Identified Per Source can be slightly edited by the administrator.
The top right of the page shows how long ago the dashboard has been updated. Frequency of updates for the Diagnostic Dashboard is set up by the administrator in the Settings tab.
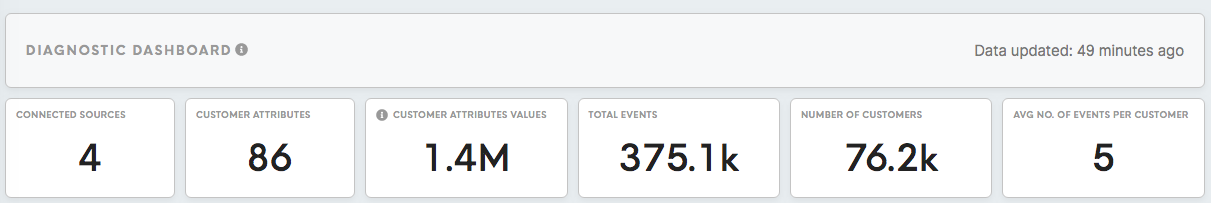
Data updated
On the top of the page is possible to see how long ago dashboard has been updated. Frequency of updates for the Diagnostic Dashboard is set up by the administration in the Settings tab.
Connected Sources
This refers to all the data sources that attributes and events are taken from. All connected sources are listed in the Sources & Destinations tab (under Data tab) and can be edited in the Administration tab.
Customer Attributes
This number demonstrates the variety of available information. Customer Attributes refers to the total number of attributes that have been identified from data sources. “A number of opened emails” and “cancelled order” are examples of attributes. All attributes are listed in the Attributes tab (under the Data tab) and can be edited by Meiro team. The attributes available for a particular customer can be seen in customer profiles.
Customer Attributes Values
This number is a summary of concrete values (i.e. 5) for an attribute for a customer. For example, Customer A has an attribute called "number of opened emails" with value 5.
Total Events
Total Events field shows the total number of events that are available based on the data sources. All listed events are available in the Events tab (under the Data tab).
Number of customers
This refers to the total number of customers whose profiles have been identified based on the data sources. Customer profiles are listed in the Customers tab.
The average number of events per customers
The average number of events (actions) per customer helps to identify the average density of information we have available for a customer.
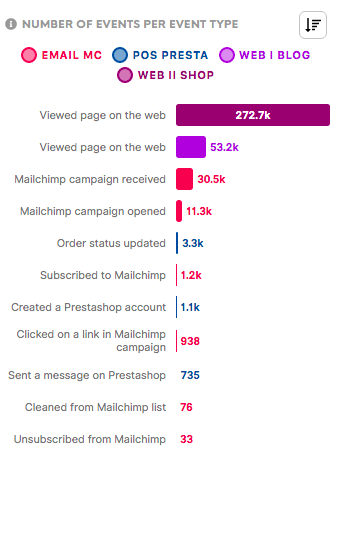
Number of events per event type
This chart shows customer engagement across different types of events captured in your project. Check out which channels and/or activities your customer engages with the most.
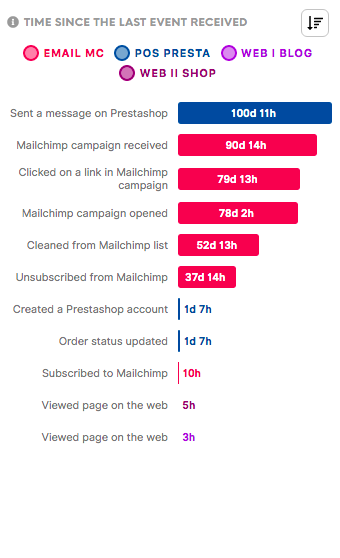
Time since the last event received
This chart shows the elapsed time since the last event of each event type. Events are usually collected daily. If the event data reception time is exceeded, it may indicate that your data is not collected frequently enough. In some cases, this may indicate that there are no new events available (for example there have not been transactions for that particular day made).
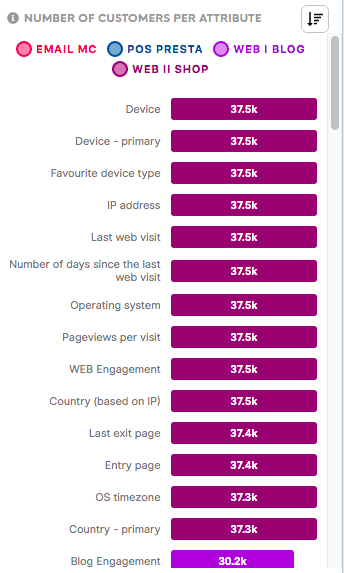
Number of customers per attribute
This chart shows the number of identified customers by each attribute in your projects.
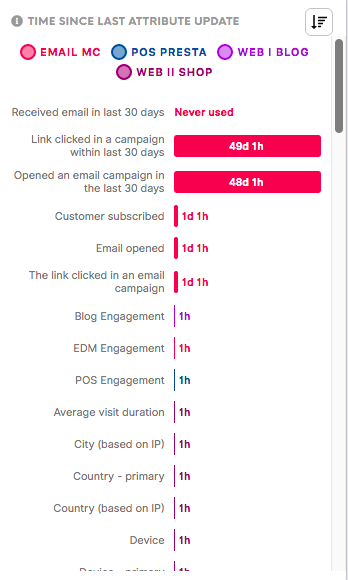
Time since last attribute update
This chart shows the elapsed time of each attribute since their last update. Attributes are normally collected and computed daily. If any of the attributes’ last update was more than the set input ingestion interval, it could indicate that your data is not being collected or re-calculated as frequently as defined.
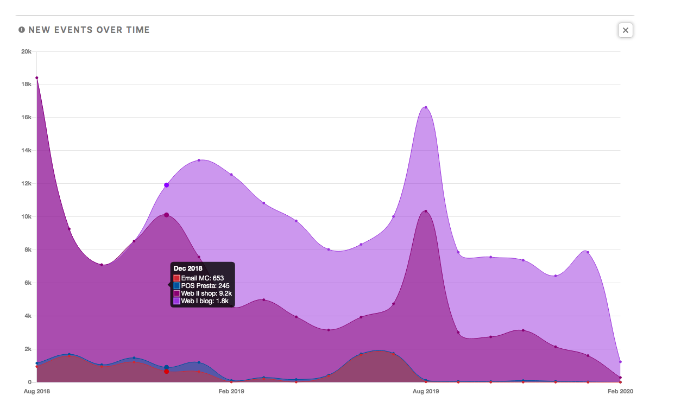
New events over time
This stacked chart shows the number of events collected by your project daily overtime. Watch out for extreme dips or spikes as they might indicate irregularity in the data.
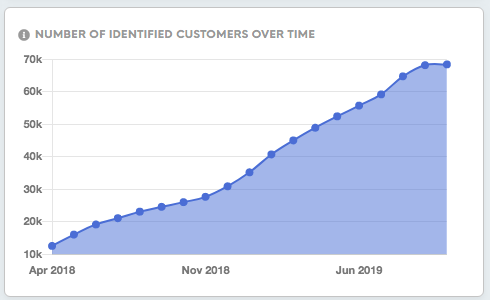
Number of identified customers over time
This chart shows the number of identified customers for your brand over the last number of days. Watch out for extreme dips or spikes as they might indicate irregularity in the data and/or customers identification process.
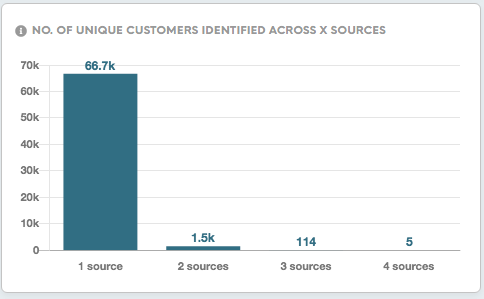
Number of unique customers identified across x sources
This chart shows the number of customers that are identified through x sources. The maximum of x is the total number of data sources. The higher the number of identified customers across data sources, the better the performance of customer profiling process, and the better the quality of the customer profile output.
Remember: It is possible to choose the data source displayed in this chart in the Administration tab
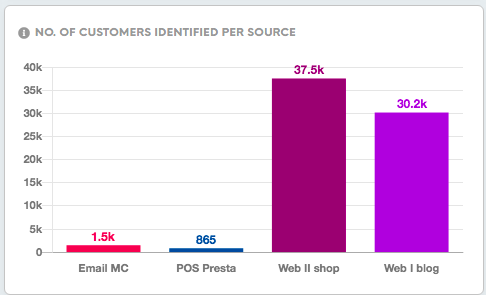
Number of customers identified per source
This profile shows the number of identified customers per data source.
Remember: It is possible to choose the data source displayed in this chart in the Administration tab
Insights tab
Insights are a set of tiles that summarize the data that matter for you. Insights tab placed in the Data tab displays insight values for your whole customers' database.
Learn: Insights for each segmented audience and in the Segments Detail tab/ Insights tab.
Remember: It is possible to create and edit insight in the Administration tab.
Search:
- By name.
- By data source of the attribute, the insight is calculated from.
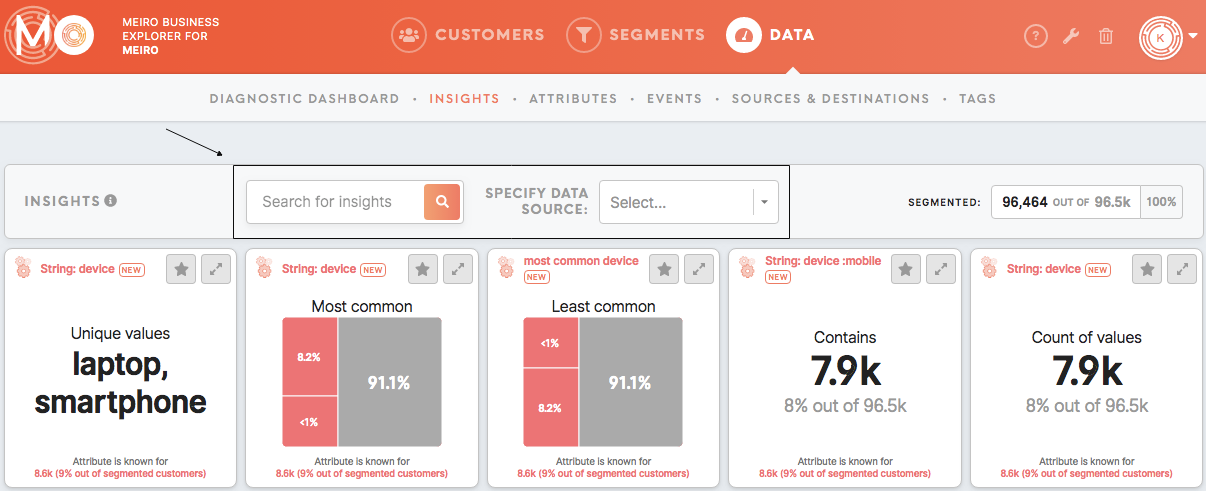
See for how many customers your insights are calculated for. Insights under the Data tab are calculated for the whole customers' database available.
In the Segmented box, you will find a "segmented number/ out of all customers | percentage".

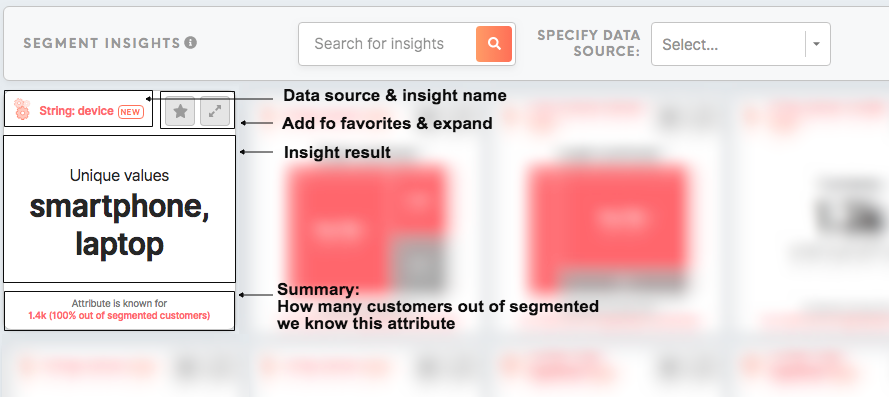
Each insight displays:
- Data source: The data source for the chosen attribute. It is assigned automatically as each attribute is calculated from a particular data source.
- Name of the insight: Name of the insight and info note (optional). Name and description can be edited by the admin in the Administration tab.
- Add to favorites (coming soon)
- Expand: By clicking on the Expand button, you will expand tile to see more insight (if available) or simply make insight bigger.
- Insight result: The attribute's condition specified for that insight, as well as the result of the calculation. Attributes and conditions for insights can be edited the admin in the Administration tab.
- Summary: Summary of how many customers out of segmented customers we know this attribute.
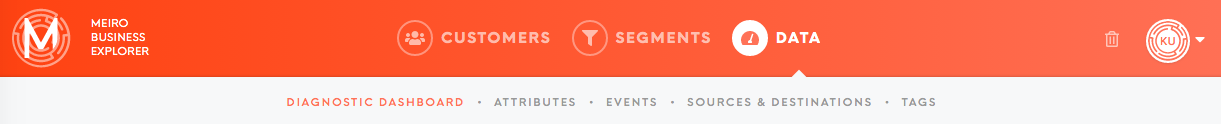
Attributes tab
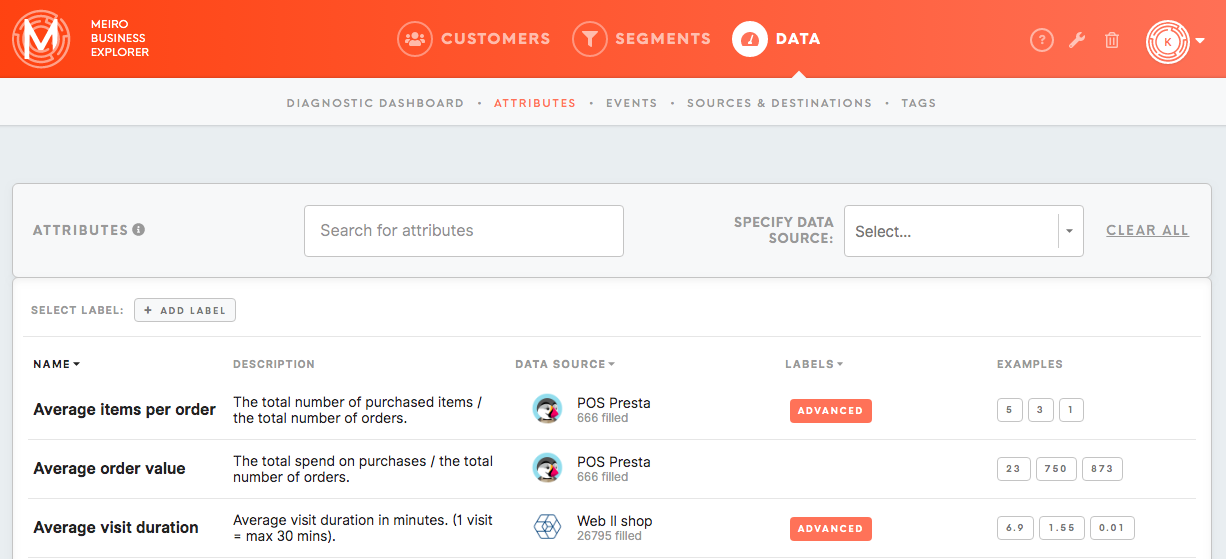
Under the Attributes tab, you have:
- Name of attributes,
- Descriptions of all available attributes,
- Their data source(s),
- Labels assigned to attributes. To understand the usage of labels please refer to this article,
- Examples of a particular attribute.
Enter your search through the search box or simply select a label.
Events tab
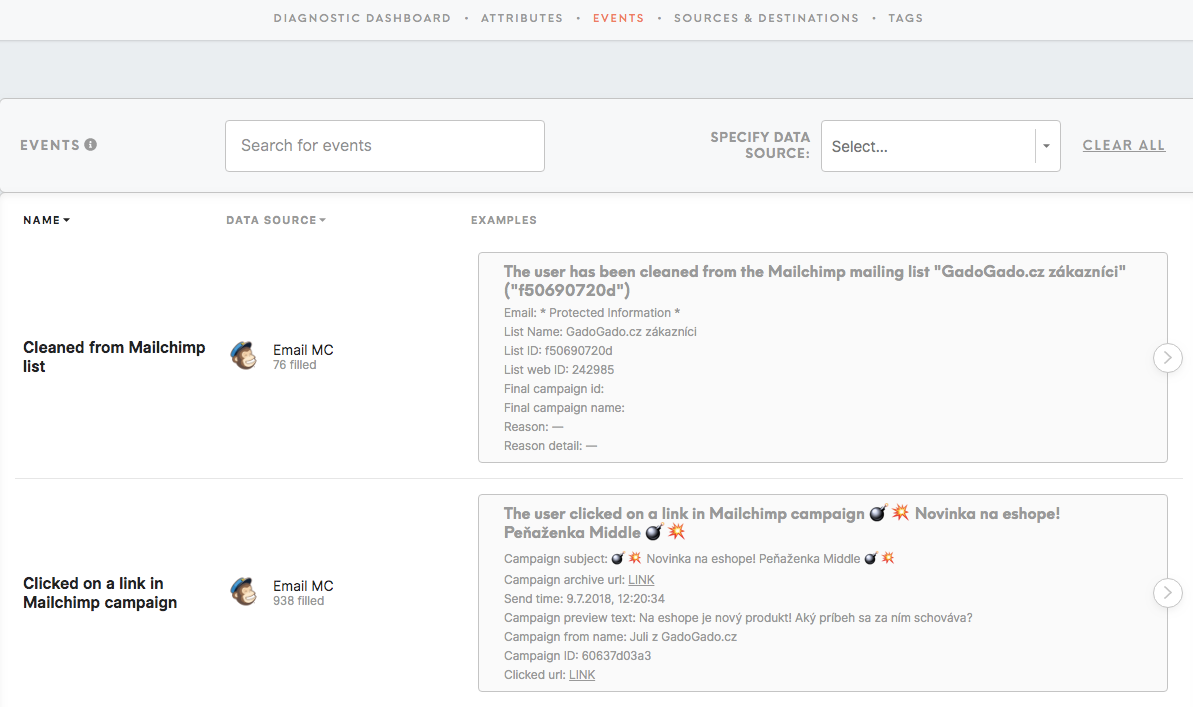
Under the Events tab, you have:
- Name of events,
- Events data sources,
- Examples of events.
Enter your search through the search box.
Sources & Destinations tab
The Sources & Destinations tab lists connected sources, as well as possible destinations you can export your data to.
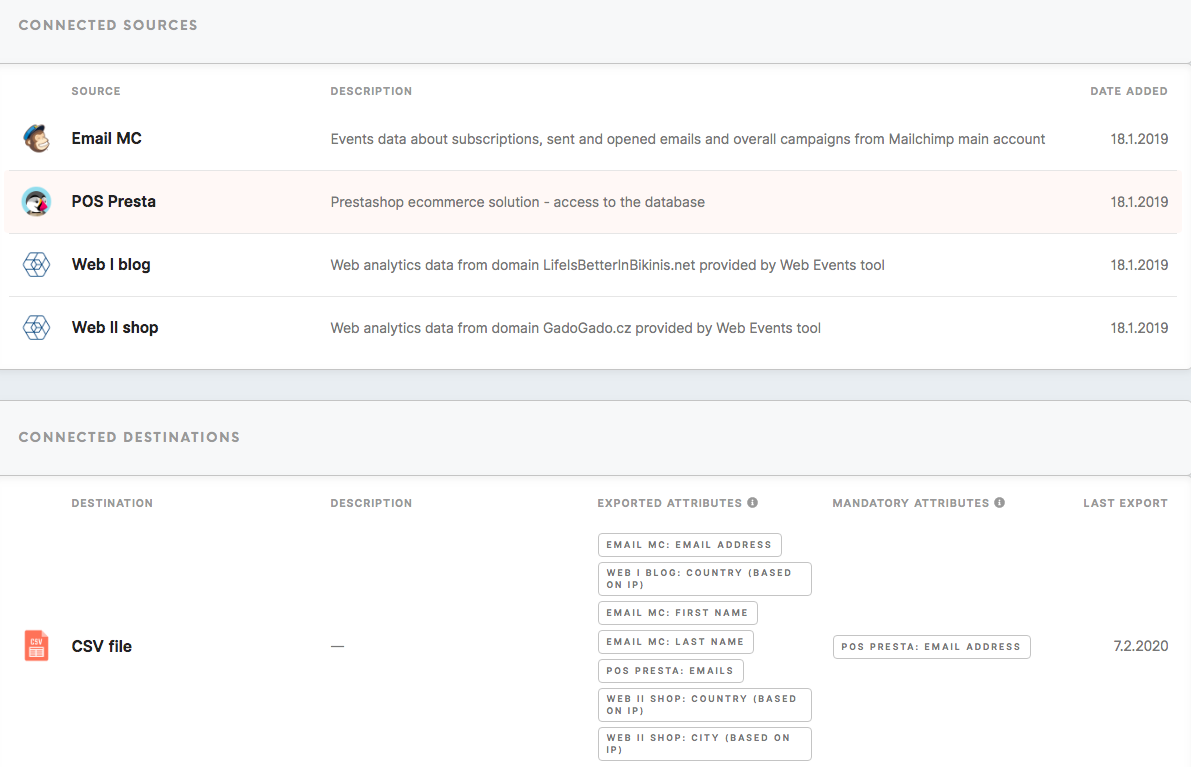
Connected Sources
The Sources & Destinations tab lists connected sources, as well as possible destinations you can export your data to.
Under the Connected Sources section, you have:
- The name of the source and description,
- The date added.
Remember: A Meiro Business Explorer administrator can edit the visibility of the connected data source for the Channel Engagement chart (Customer Profile Detail) or the Diagnostic Dashboard in the Administration tab (Sources & Destinations tab).
Connected Destinations
Under the Connected Destinations section, you have:
- Destinations names and descriptions,
- Exported attributes (attributes that will be exported to your chosen destination),
- Mandatory attributes (attributes that must be present in order to export to the destination)
- Last export date.
Remember: Settings for sources and destinations can be edited by the Meiro Business Explorer administrator in the Administration tab.
Tags tab
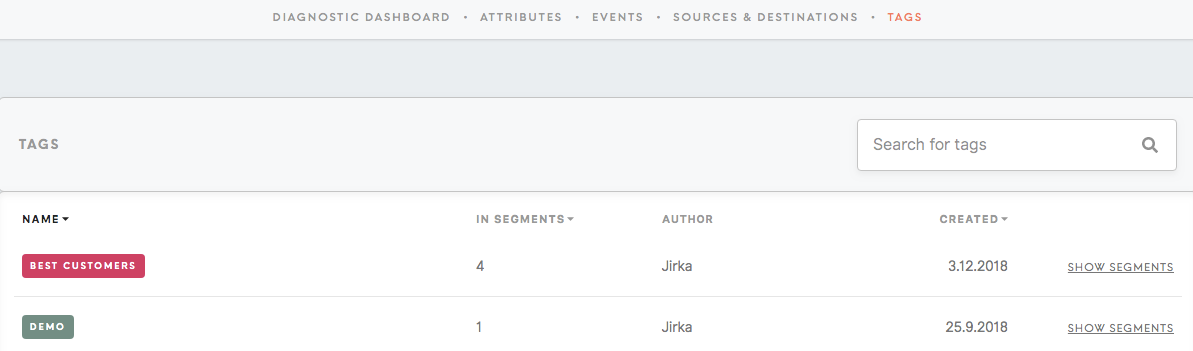
Remember: The administrator of Meiro Business Explorer can create and edit tags in the Administration tab.
Recommended articles
Learn: Understand the bigger picture of your data