Tutorial: Google Analytics connector
In this tutorial, we will explain how to connect data from the Google Analytics connector to Meiro Integrations and run a simple query.
The article demonstrates how to do the following:
- Create the Google Analytics account
- Create the Google Analytics connector in Meiro Integrations
- Authorize Meiro Integrations to connect to the Google Analytics account
- Set up configuration Parameters for the Google Analytics connector
- Run the connector
1. Create a Google Analytics Account
1.1 Go to the Google Analytics website and Sign up.
1.2 Fill the form. Remember the account name, it will be useful during connecting to Meiro Integrations. Accept the terms of service agreement.
1.3 Add Tracking ID to the website you wish to follow.
You can find more info about Google Analytics in the official documentation.
2. Create Google Analytics Connector in Meiro Integrations
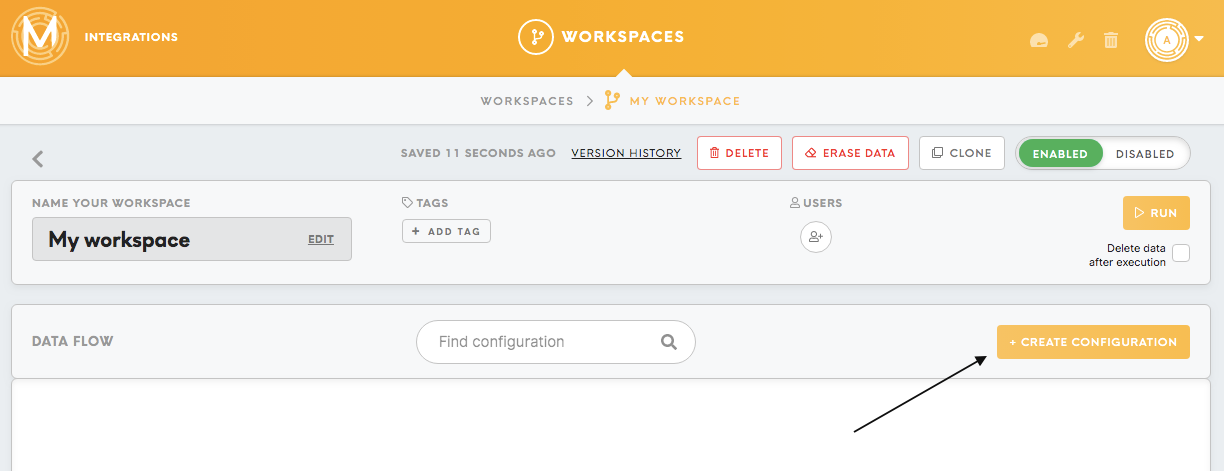
2.1 Click on the Create Configuration button.
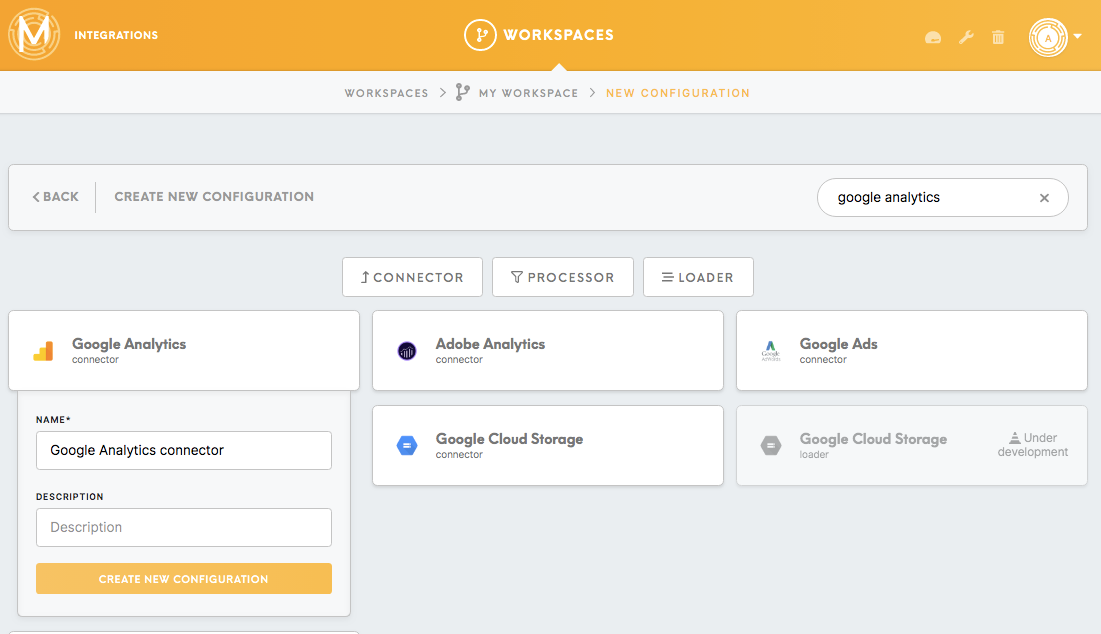
2.2 Choose the Google Analytics connector. Give it a name (required) and add a description (optional), click on the Create New Configuration button.
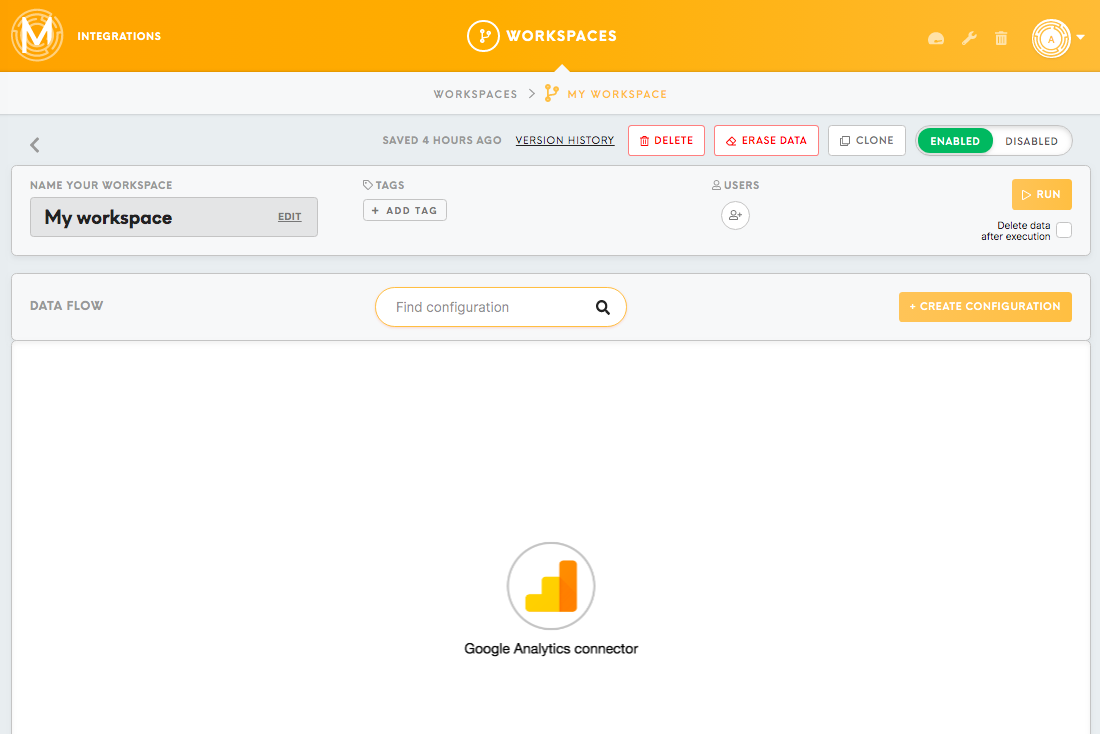
2.3 Icon of the Google Analytics connector should be visible in your workspace.
3. Authorize Meiro Integrations to use Google Analytics account
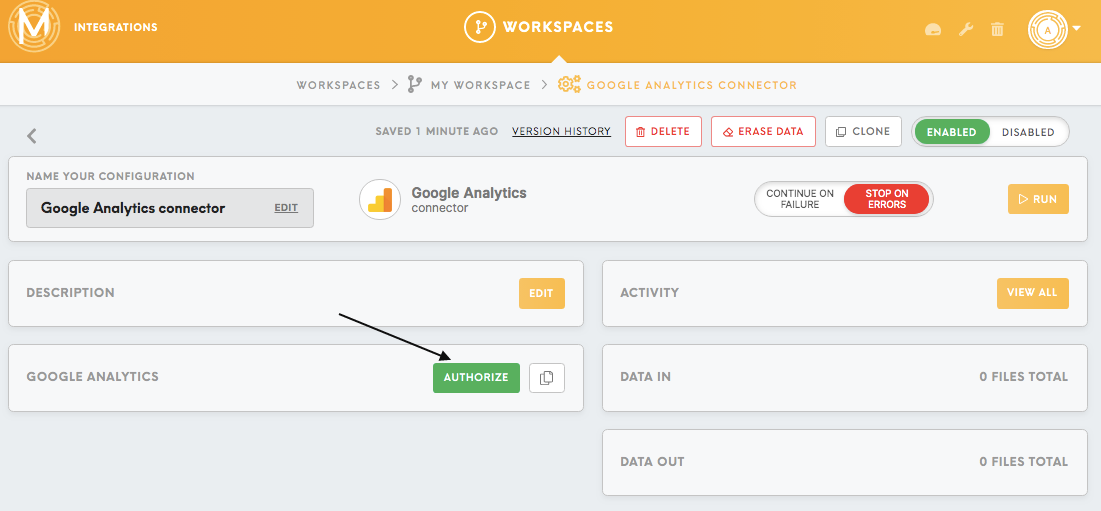
3.1 Click on the Google Analytics connector icon in your workspace to open the configuration. Authorize Meiro access to Google Analytics, Choose an account and allow Meiro.io to access your Google Analytics account and spreadsheets on Google Drive.
4. Set up Parameters for Google Analytics Connector
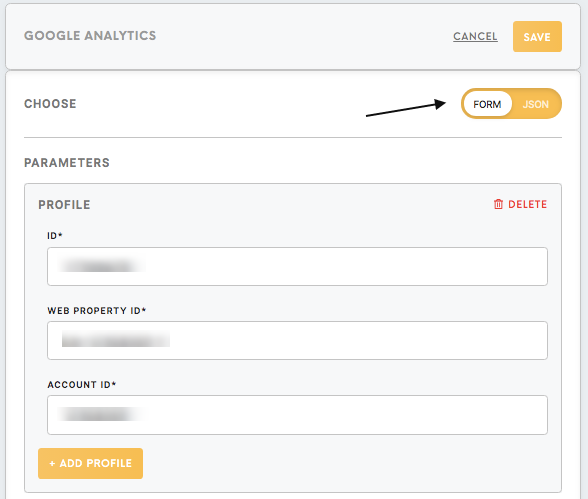
4.1 To edit Parameters click on the Edit button in the Google Analytics connector form. You can see Parameters in either form format or JSON format. Set up the Profile for your Google Analytics account. To add more Profiles, click on the Add Profiles button.
5 Define the Query
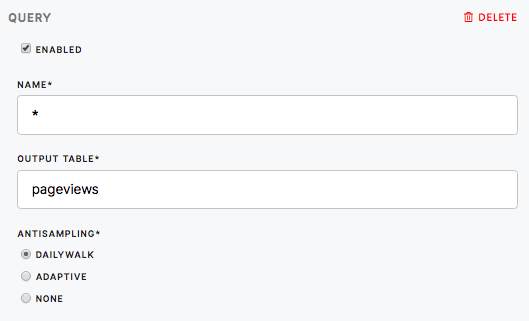
5.1 Click on the Enabled box if you wish the query to be run.
5.2 The Name (required) and the Output table (required) should be chosen by you in a way that you wish to see it later in the Data Out.
5.3 Choose one of the options from the Antisampling (required): DailyWalk, adaptive or none.
To learn more about it, please refer to this article.
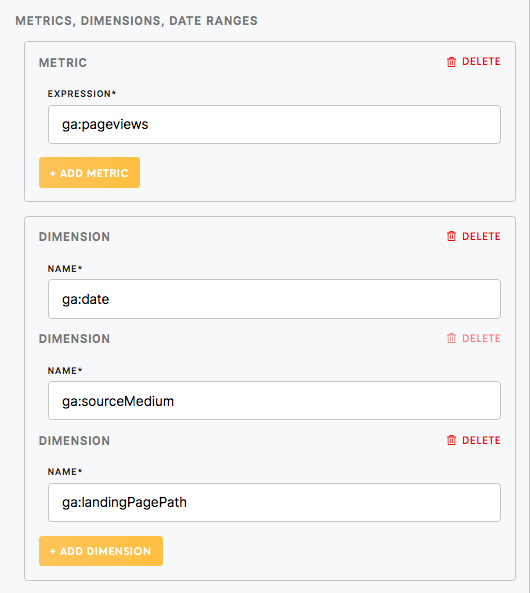
5.4 Fill in the Metrics and dimensions section. The example below demonstrates the data about customer’s page views using time (date), the source of the traffic, and landing page dimensions. For example, based on the Metrics and Dimensions from the Google Analytics documentation we choose:
For example Metric Ga:pageviews (for the total number of pages viewed) and Dimensions:Ga:date (for dates of the entries), ga:sourceMedium (or the origin of the traffic),ga:landingPagePath (for the landing page of the user’s session).
If you wish to add more Metrics or Dimensions, click on the Add Metrics, Add Dimensions button.
5.5 Set up the filter expression for the filter data downloaded from Google Analytics. For example, to filter all the results where the time on the page is exactly ten seconds, we need to use Filter Expression based on the information from the Google Analytics documentation: filters=ga:timeOnPage%3D%3D10.
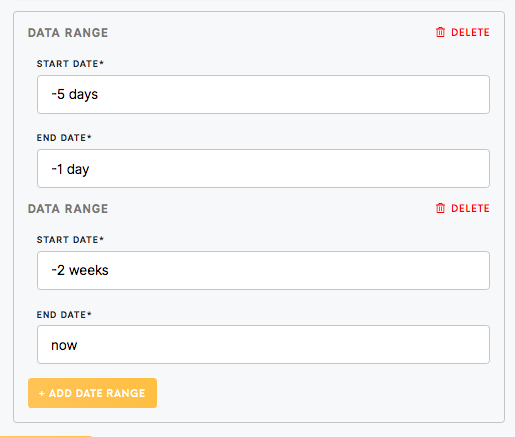
5.6 Add Data ranges if you wish to set up a certain timeframe for the query.
6. Run the Connector
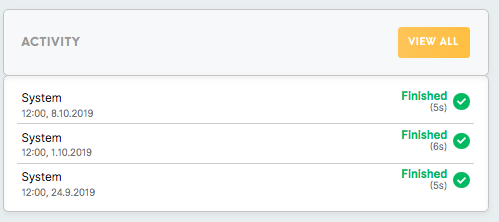
6.1 Click on the Run button, results will be visible in the Activity box.
If your connection was established successfully as a result, you should see CSV tables in the Data Out bucket out/tables.

