Understand the bigger picture of data available in Meiro
|
Learn from this article about: Reports |
The Analytics tab will help you to understand the bigger picture of your available data: Diagnostic Dashboard, Insights, and Reports.
Diagnostic Dashboard
Diagnostic Dashboard summarizes available customer profile data: update time, number of customer profiles, events, attributes, and more.
- The number of customers
- Connected sources
- Customer attributes
- Total events
- Data updated
- Monthly processed events
- Total events stored (as of now)
- The number of unified customers
Learn more: about examples of charts under the Diagnostic dashboard.
Insights tab
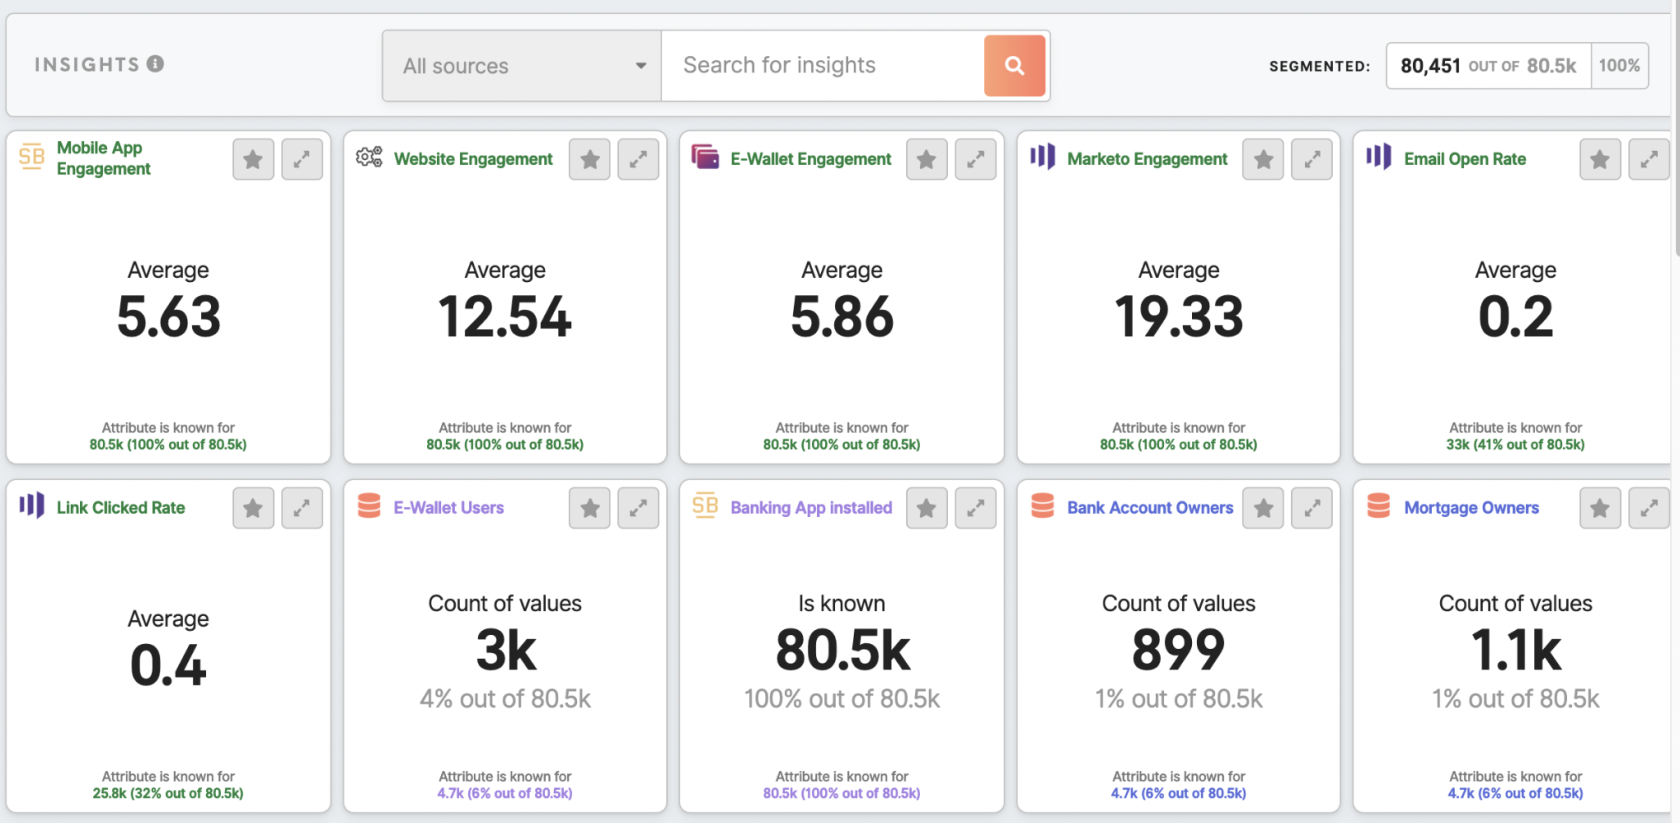
Insights are counted for the whole customer profiles' database (insights are also available for each segment).
Insights are a set of tiles with various analytics for segmented groups. Insights are built based on attributes and conditions (e.g., most common location, device, count of customers that bought a product).
Learn more: about insight from this article.
Reporting tab
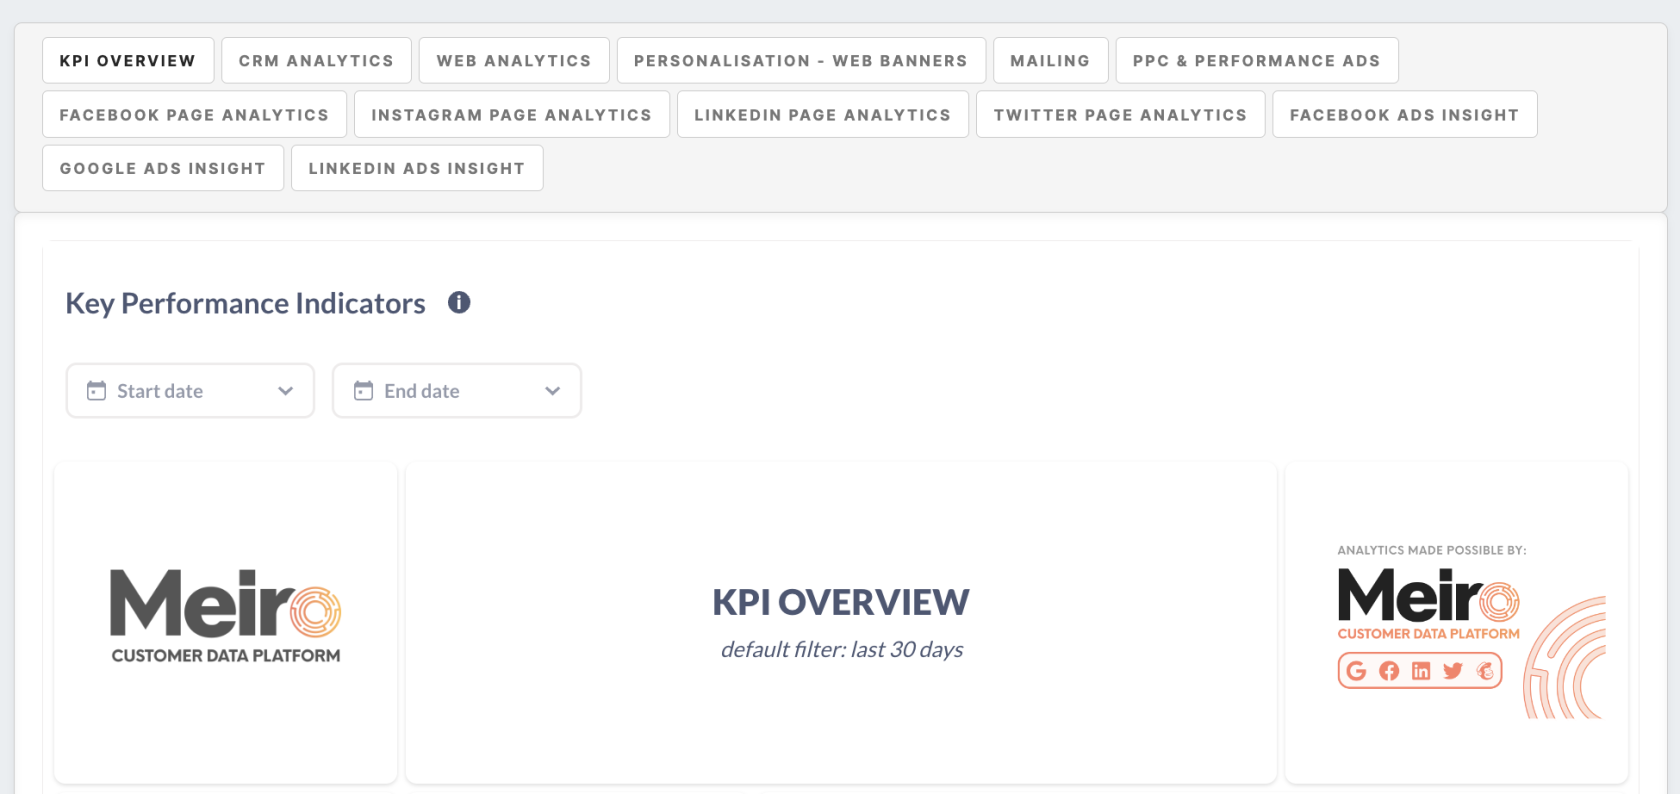
Reporting tab displays the basic dashboards available for each client within Meiro Business Explorer, as well as customized dashboards at additional costs.
Learn more: about available reporting dashboards templates.
Attributes, events, sources & destinations
Check out in the Data library tab what attributes, events, sources, and destinations are available.
- Attributes: all attributes known for the customer profiles database. Based on attributes and their values segment audiences in the Segments tab.
- Events: activities of customer profiles. Events are used in each customer profile to describe their activity (events).
- Sources: from where customer data is known from.
- Destinations: where segmented data can be exported to activate it further.


