Users Activity tab in details

Users Activity tab reports on activity of users across Meiro Business Explorer.
It is possible to filter users' activity by:
- the user/ user roles/ domains of users' emails (filter includes deleted users)
- date range (counted in the timezone of the server- which can be found in the Users Settings).
Users Activity tab updates in real time.
| Name of the chart |
Available filters
|
| Users Activity |
- Total number of users
- Number of currently active users
- Number of never activated users
- Number of deleted users
|
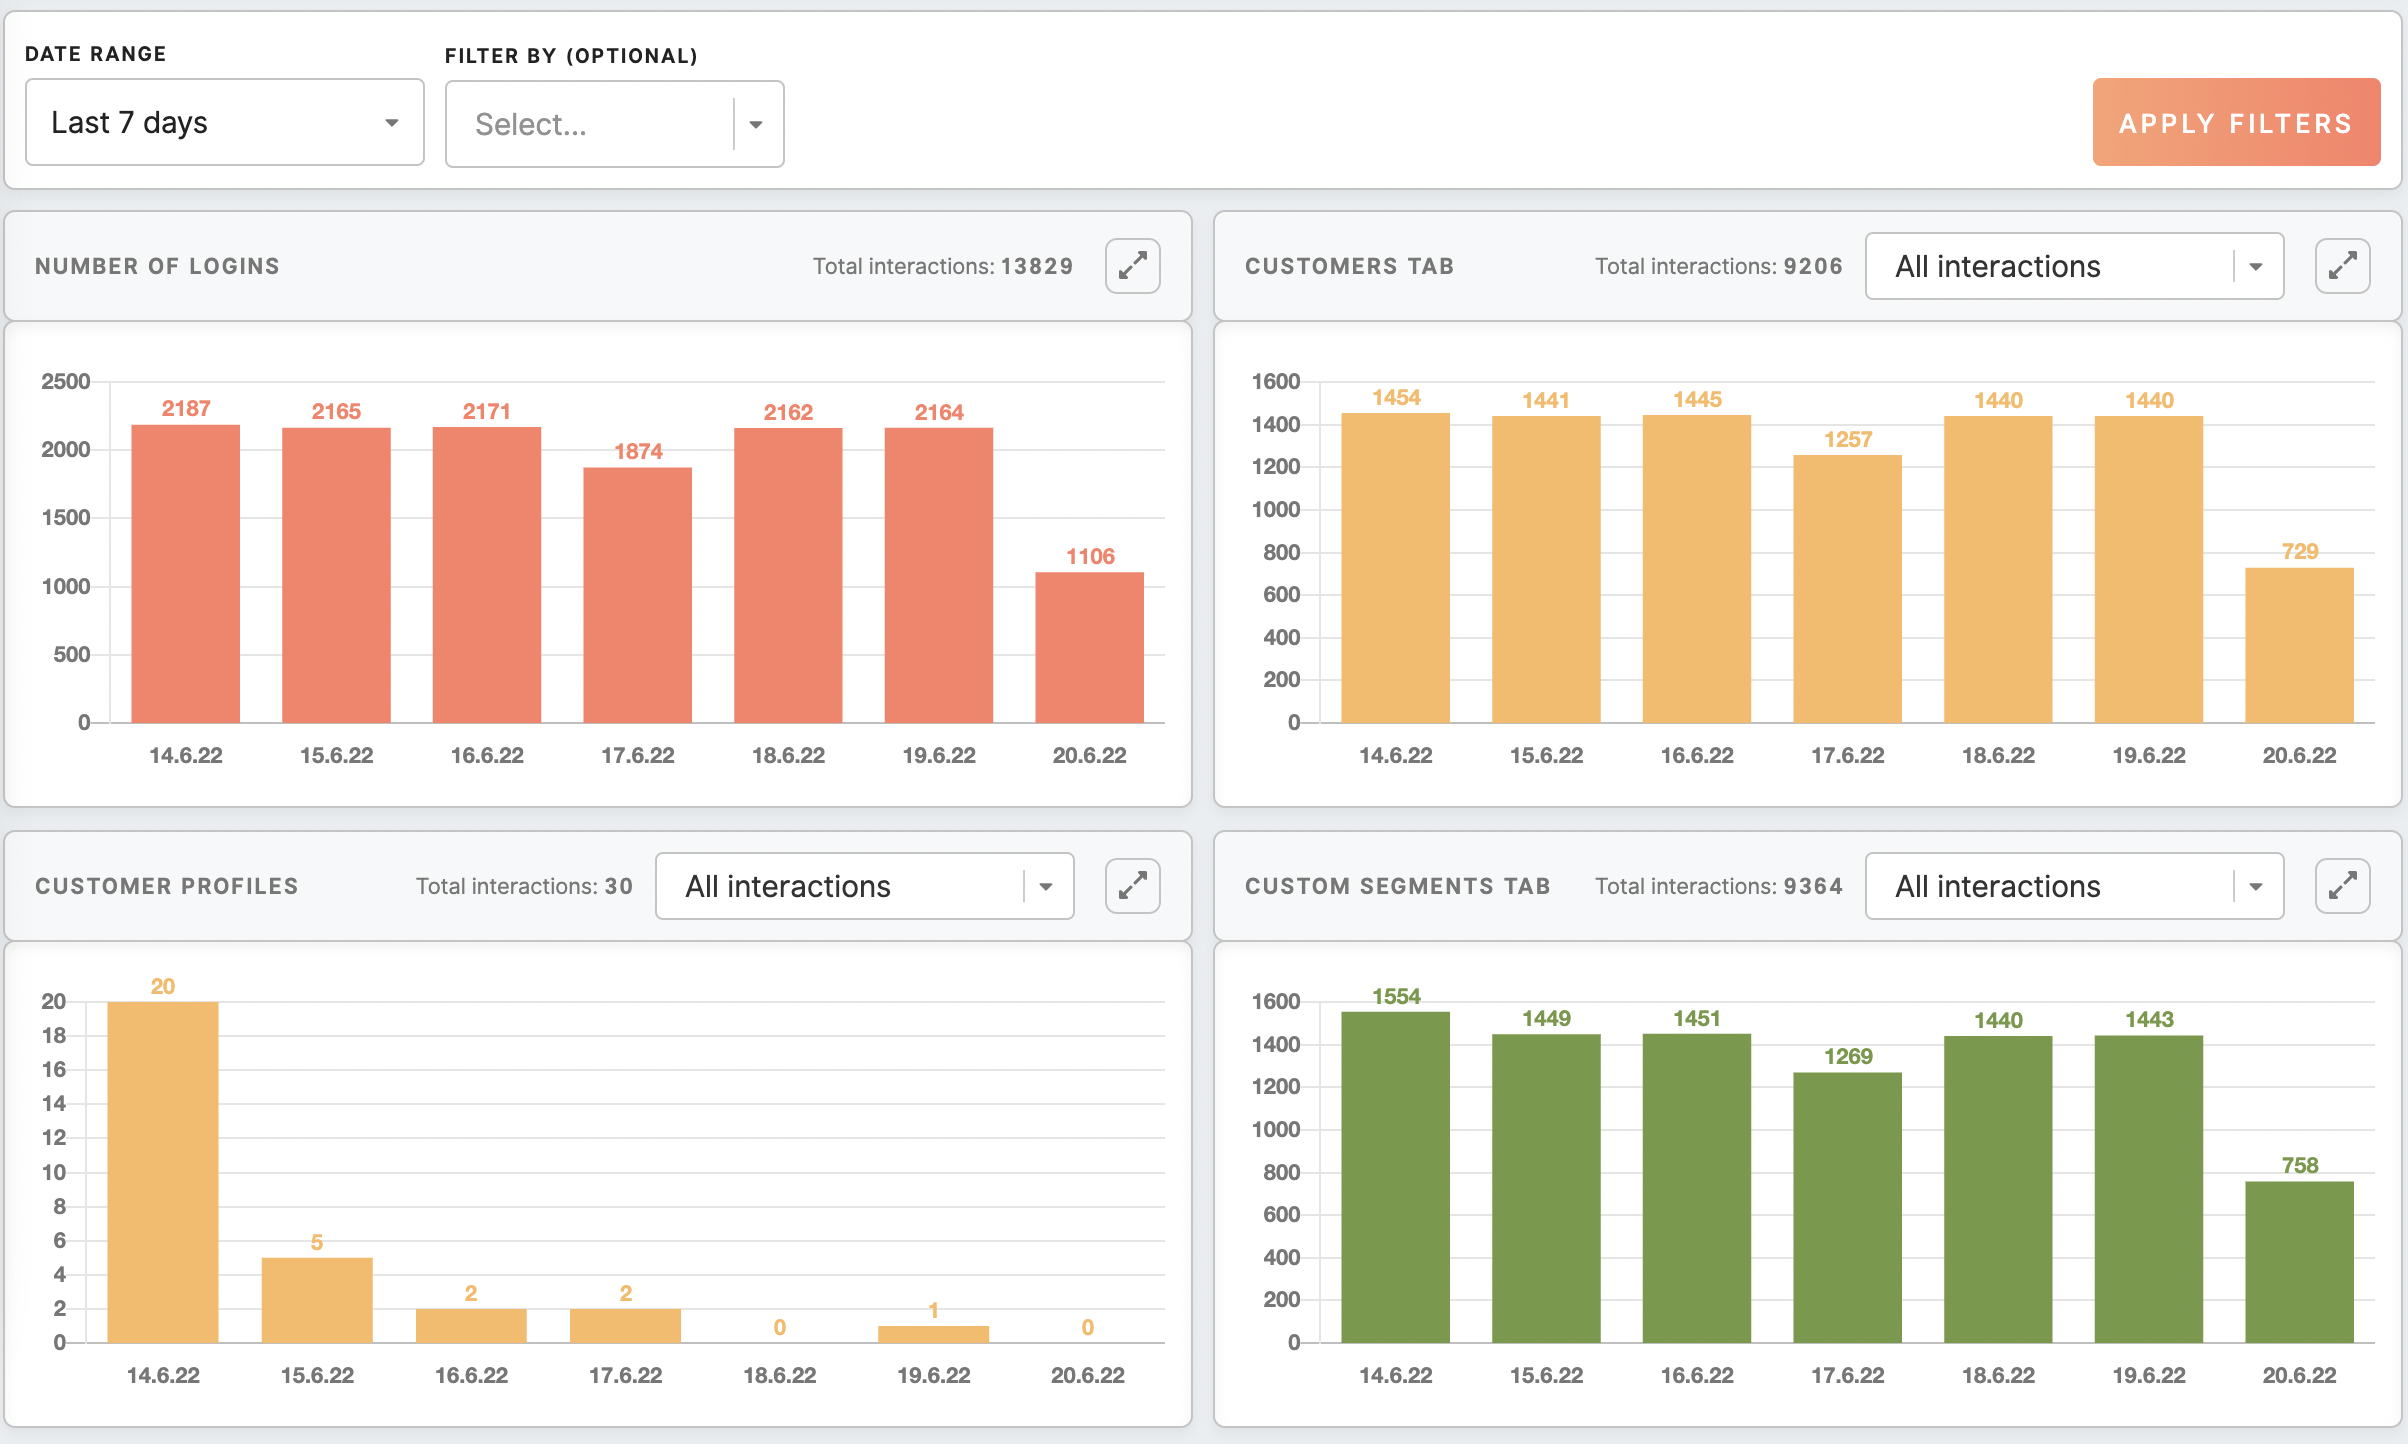
| Logins |
How many times users logged in to Meiro Business Explorer. |
| Customers tab |
- Sum of all interactions mentioned below
- Viewed (how many times tab was viewed)
- Searched (how many times a user clicked on "search"button)
|
| Customer profile tabs |
- Sum of all interactions mentioned below
- How many times a user viewed attributes subtab Please keep in mind each time user loads customer profile, it is brought to attributes subtab.
- How many times user viewed timeline subtab
- How many times user viewed identity subtab
|
| Custom segments tab |
- Sum of all interactions mentioned below
- Number of created custom segments
- Number of copied custom segments
- Number of deleted custom segments
- Number of edited custom segments
- Number of exported custom segments (how many times user clicked on the "export" button)
- Number of views of Custom Segments tab
- Number of views of "My segments"
- Number of views of "Shared with me"
- Number of views of "Others"
- Number of views of segment detail tab
|
| Featured segments tab |
- Sum of all interactions mentioned below
- Number of created featured segments
- Number of copied featured segments
- Number of deleted featured segments
- Number of edited featured segments
- Number of exported featured segments (how many times user clicked on the "export" button)
- Number of views of Featured Segments tab
- Number of views of segment detail tab
|
| Smart segments tab |
- Sum of all interactions mentioned below
- Number of created smart segments segments
- Number of copied smart segments
- Number of deleted smart segments
- Number of edited smart segments
- Number of exported smart segments (how many times user clicked on the "export" button)
- Number of views of Smart Segments tab
- Number of views of segment detail tab
|
| Data tab |
- Sum of all interactions mentioned below
- Number of views of Diagnostic Dashboard tab. Please keep in mind each times the user loads the Data tab, it is brought to the Diagnostic Dashboard tab.
- Number of views of Insight tab (count of view for insights tab across the product, also in segment detail)
- Number of views of Attributes tab
- Number of views of Events tab
|
| Reporting tab |
- Sum of all interactions mentioned below
- Number of views of Reporting tab
- Number of created reports
- Number of edited reports
- Number of deleted reports
|
| Pop up web banners tab |
- Sum of all interactions mentioned below
- Number of views of Pop up web banners tab
- Number of created pop up web banners
- Number of edited pop up web banners
- Number of copied pop up web banners
- Number of deleted pop up web banners
|
| Embedded web banners tab |
- Sum of all interactions mentioned below
- Number of views of Embedded web banners tab
- Number of created embedded web banners
- Number of edited embedded web banners
- Number of copied embedded web banners
- Number of deleted embedded web banners
|
| Promo codes tab |
- Sum of all interactions mentioned below
- Number of views of Promo codes tab
- Number of created promo codes
- Number of edited promo codes
- Number of deleted promo codes
|