Tab: Analytics
Diagnostic Dashboard tab
The Diagnostic Dashboard displays information about the data of yoursummarizes available customer profiles.profile
Remember: all data will be recalculated on the latest refresh. View in the top right corner when data was updated at the latest. Due to this reason if thedata: update wastime, donenumber inof acustomer differentprofiles, periodevents, you may notice differences between data presented in the Diagnostic Dashboardattributes, and other parts of the product that are calculated instantly e.g., segment calculation or profile search.more.
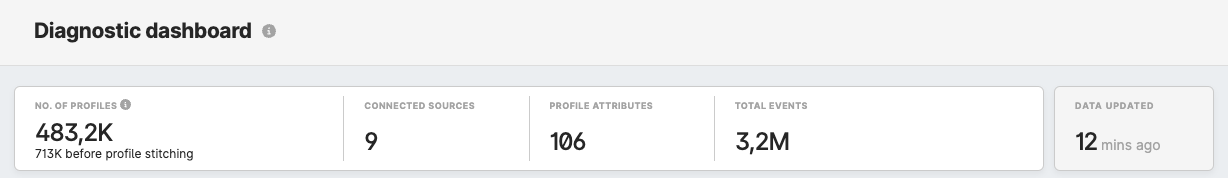
- The number of profiles
|
The total number of profiles. Browsing through all customer profiles is possible in the Profiles tab. |
- Connected sources
|
The number of all the data sources connected. All connected sources are listed in the Data Library/ Sources tab |
Profiles- Profile attributes
|
The total number of profiles all attributes. All attributes are listed in the Data Library/ Attributes tab. |
- Total events
|
The total number of events for all customer profiles, including the hidden ones. All visible and hidden events are listed under Admin/Entities/Events tab. |
- Data updated
|
How long ago has the dashboard been updated |

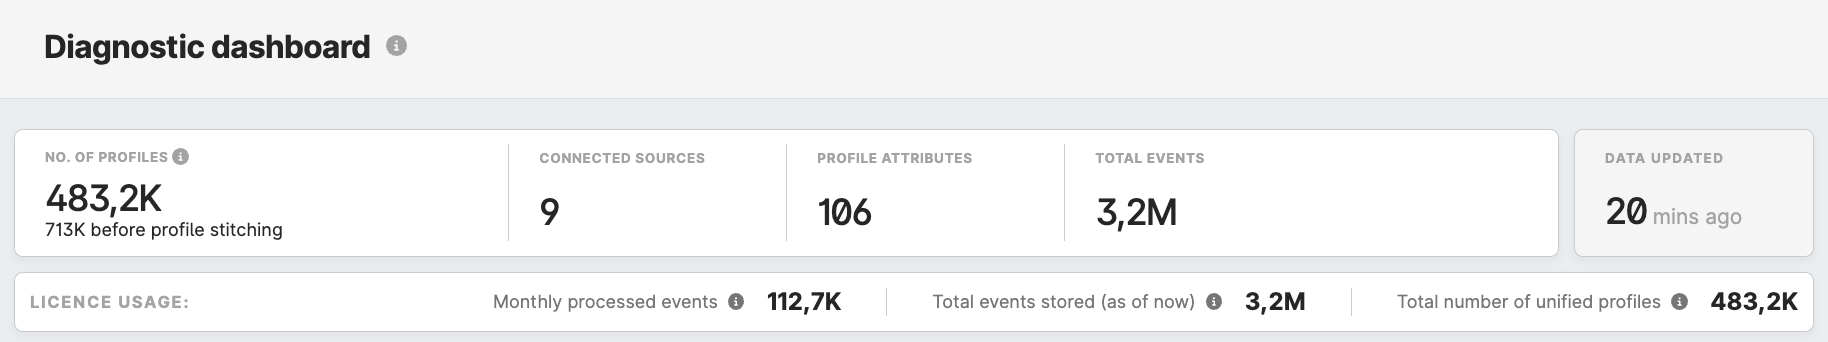
License usage will be visible only to users that are granted access in their user role.
Monthly processed events
(last 30 days)
|
Total events processed in the last 30 days.
|
Total events stored (as of now)
|
Total events in storage, including hidden events.
|
Total
The number of unified profiles
|
TotalLearn numbermore: about examples of unifiedcharts profilesunder after identity stitching.
|
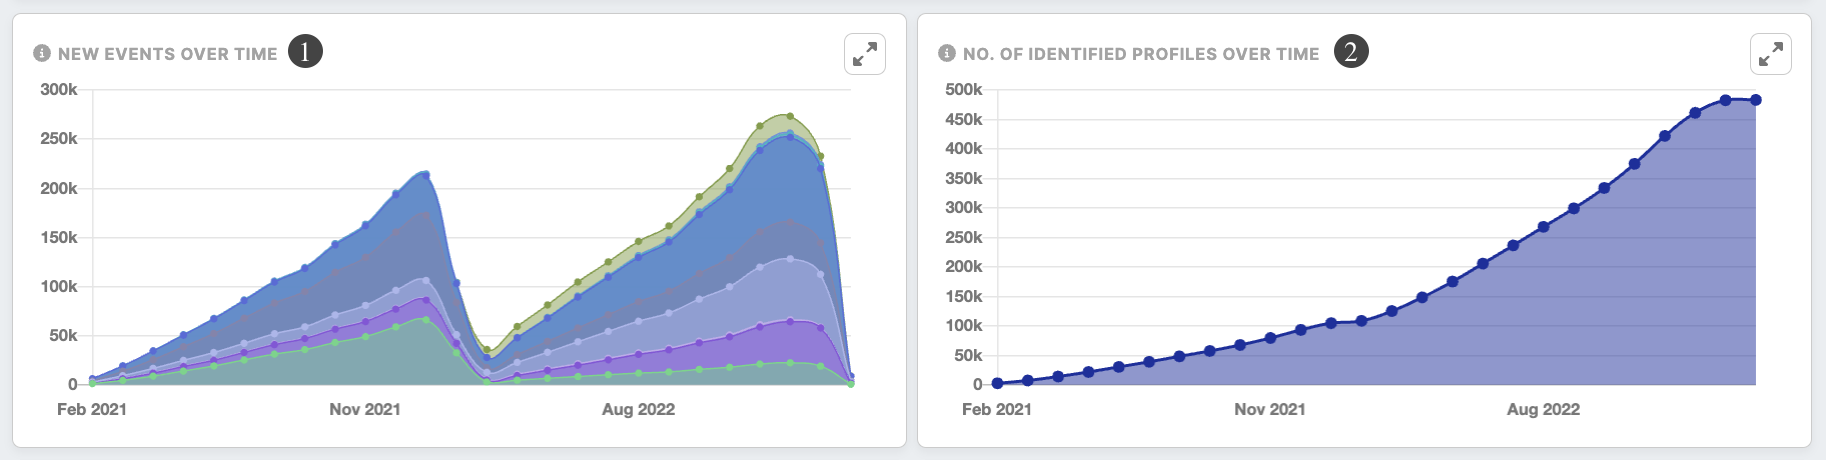
New events over time(1) |
Stacked chart with the numberDiagnostic of events collected. Watch out for extreme dips or spikes as they might indicate irregularity in the data.
Resolution for charts is auto-calculated in:
days - if the events activity <= 60 days
weeks - if the events activity <= 60 * 7 days
months - otherwise (events activity > 60 * 7 days)
|
Number of identified profiles over time (2) |
The number of identified profiles across the time. Watch out for extreme dips or spikes as they might indicate irregularity in the data and/or customer profiles' identification process.dashboard.
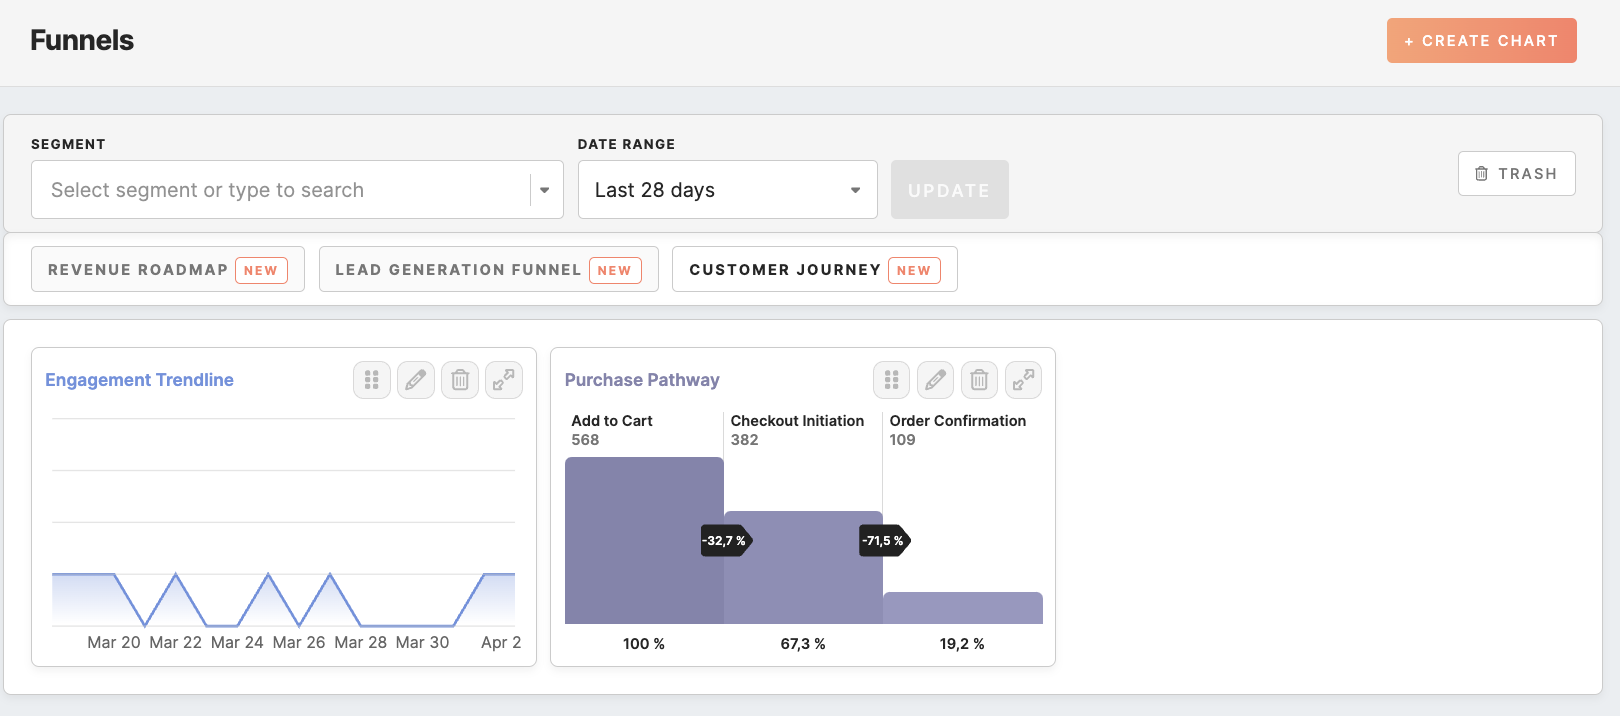
Funnels tab
ResolutionFunnels forare chartsan isanalytical auto-calculatedtool in:
designed daysto -unveil ifinsights theinto profilesuser identifiedbehavior <=and 60track days
conversion weeksrates -toward ifspecific theobjectives. profilesBy identified <= 60 * 7 days
months - otherwise (events activity > 60 * 7 days)
|

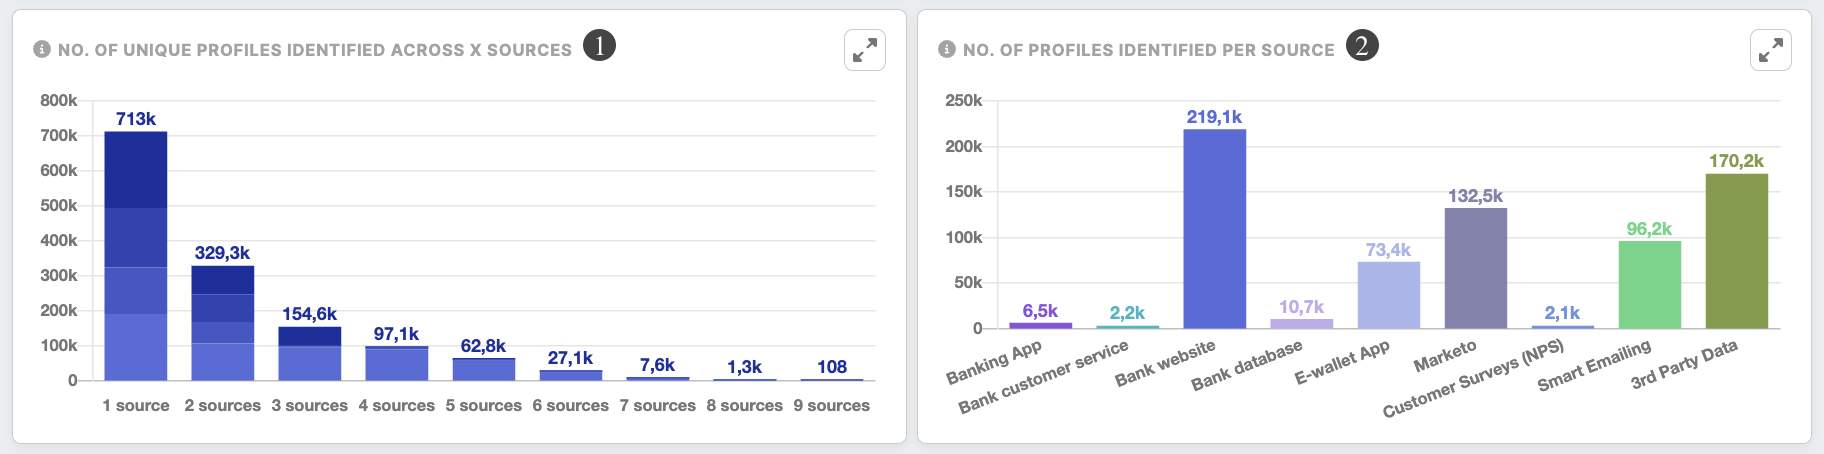
The number of unique profiles identified across x sources(1) |
The number of profiles identified through x sources. The maximum of x is the total number of data sources. The higher the number of identified profiles across data sources, the better the performance ofvisualizing the customer profilingjourney processthrough various stages, such as completing a purchase or signing up for a service, funnels offer a clear depiction of user progression and thepotential betterbottlenecks. Through bar charts representing customer transitions between steps, users can easily identify areas for improvement and optimize the qualityoverall ofcustomer experience. The tool's ability to analyze conversion trends empowers users to pinpoint changes in website functionality or the customer profilejourney output. | that
impact conversion Therates, numberfacilitating ofinformed profilesdecision-making identifiedand perstrategic source(2) |
This profile shows the number of identified customer profiles per data source. |
enhancements.
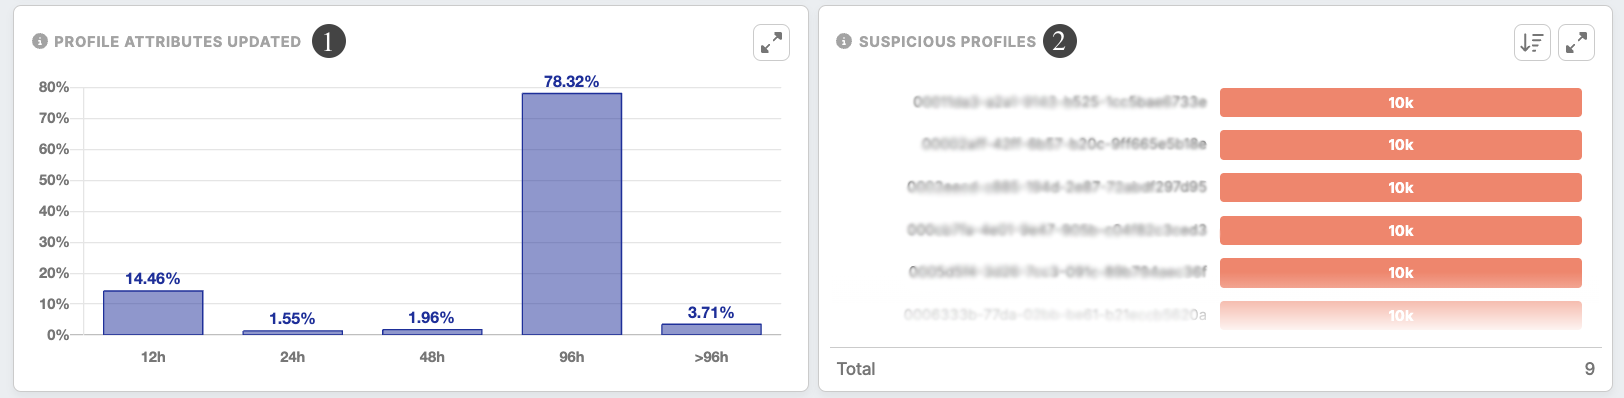

Learn more: about funnels | and Profiles'how attributesthey updated (1)
|
This chart shows if the profiles' attributes are kept up to date. Immediate updates happen each time a new event arrives. Also, when a customer profile entity merges with another entity. Depending on the instance, full entities refresh happens from 1 - 7 days.
|
Suspicious profiles (2)
|
This chart shows the list of top 10 profile entities with a suspiciously large number of events (>= 10000). By clicking on the customer profile ID, the user will be redirected to the customer’s profile page.
|
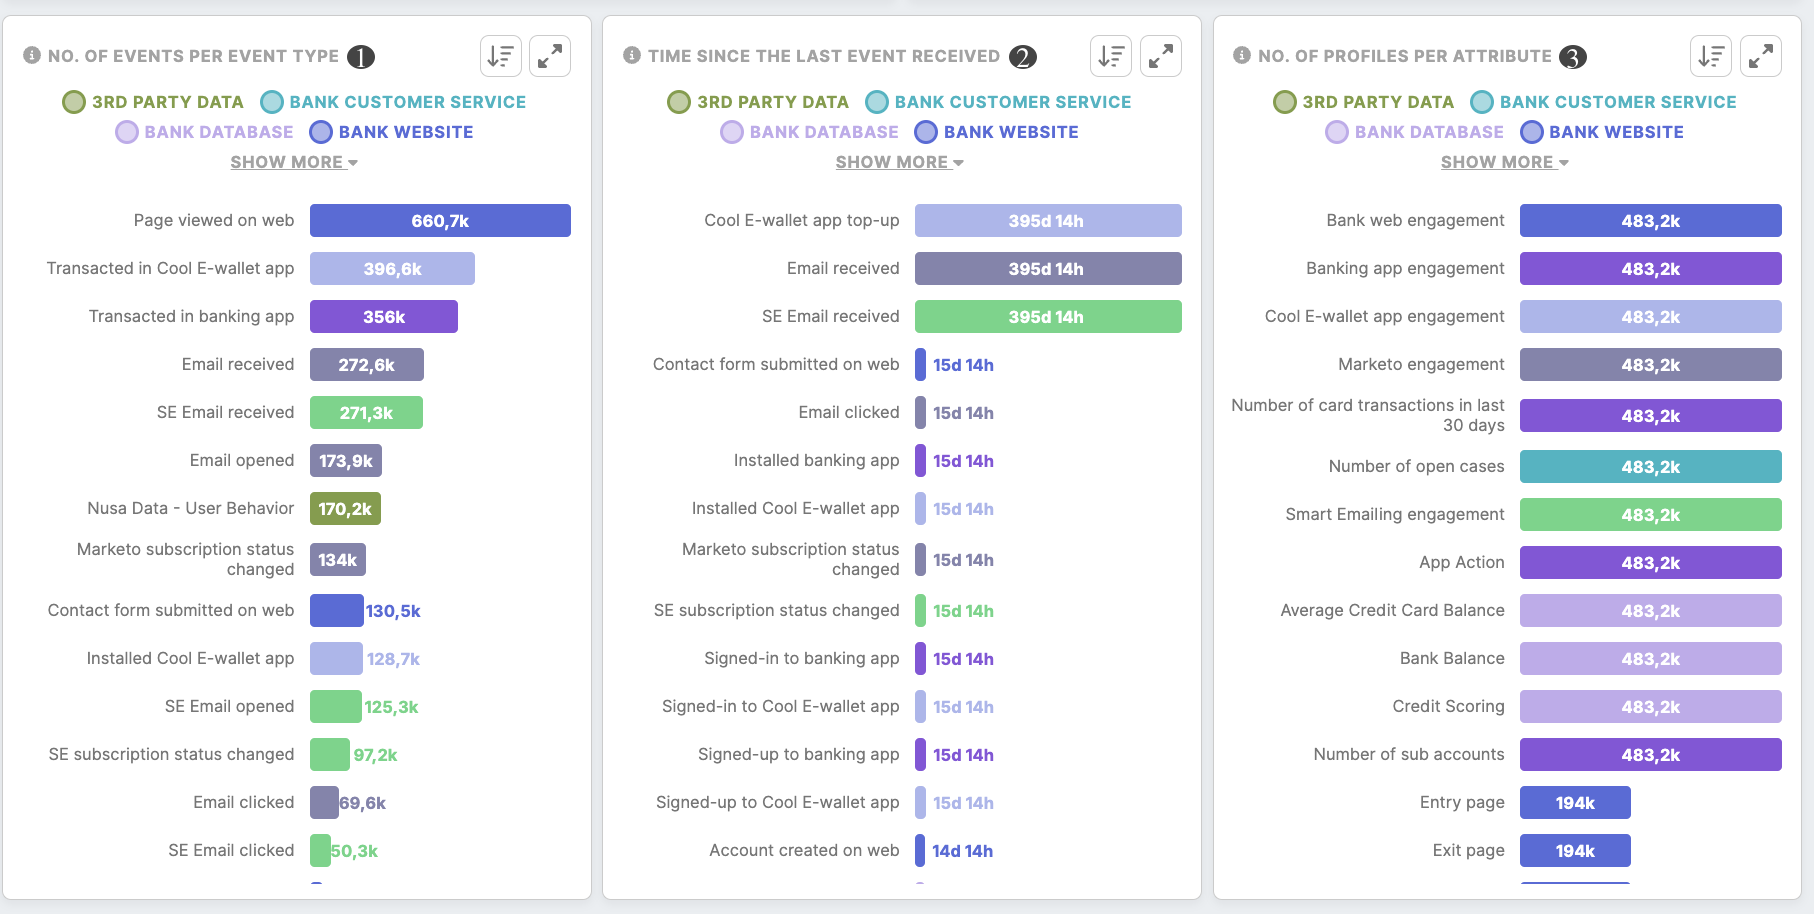
The number of events per event type(1) |
Customer engagement across different types of events capturedwork in your project. Check out which channels and/or activities your customer engages with the most. |
The time since the last event received(2) |
The elapsed time since the last event of each event type. Events are usually collected daily. If the event data reception time is exceeded, it may indicate that your data is not collected frequently enough. In some cases, this may indicate that there are no new events available (for example, there have not been transactions for that particular day made). article |
The number of profiles per attribute(3) |
The number of identified profiles by each attribute in your projects. |
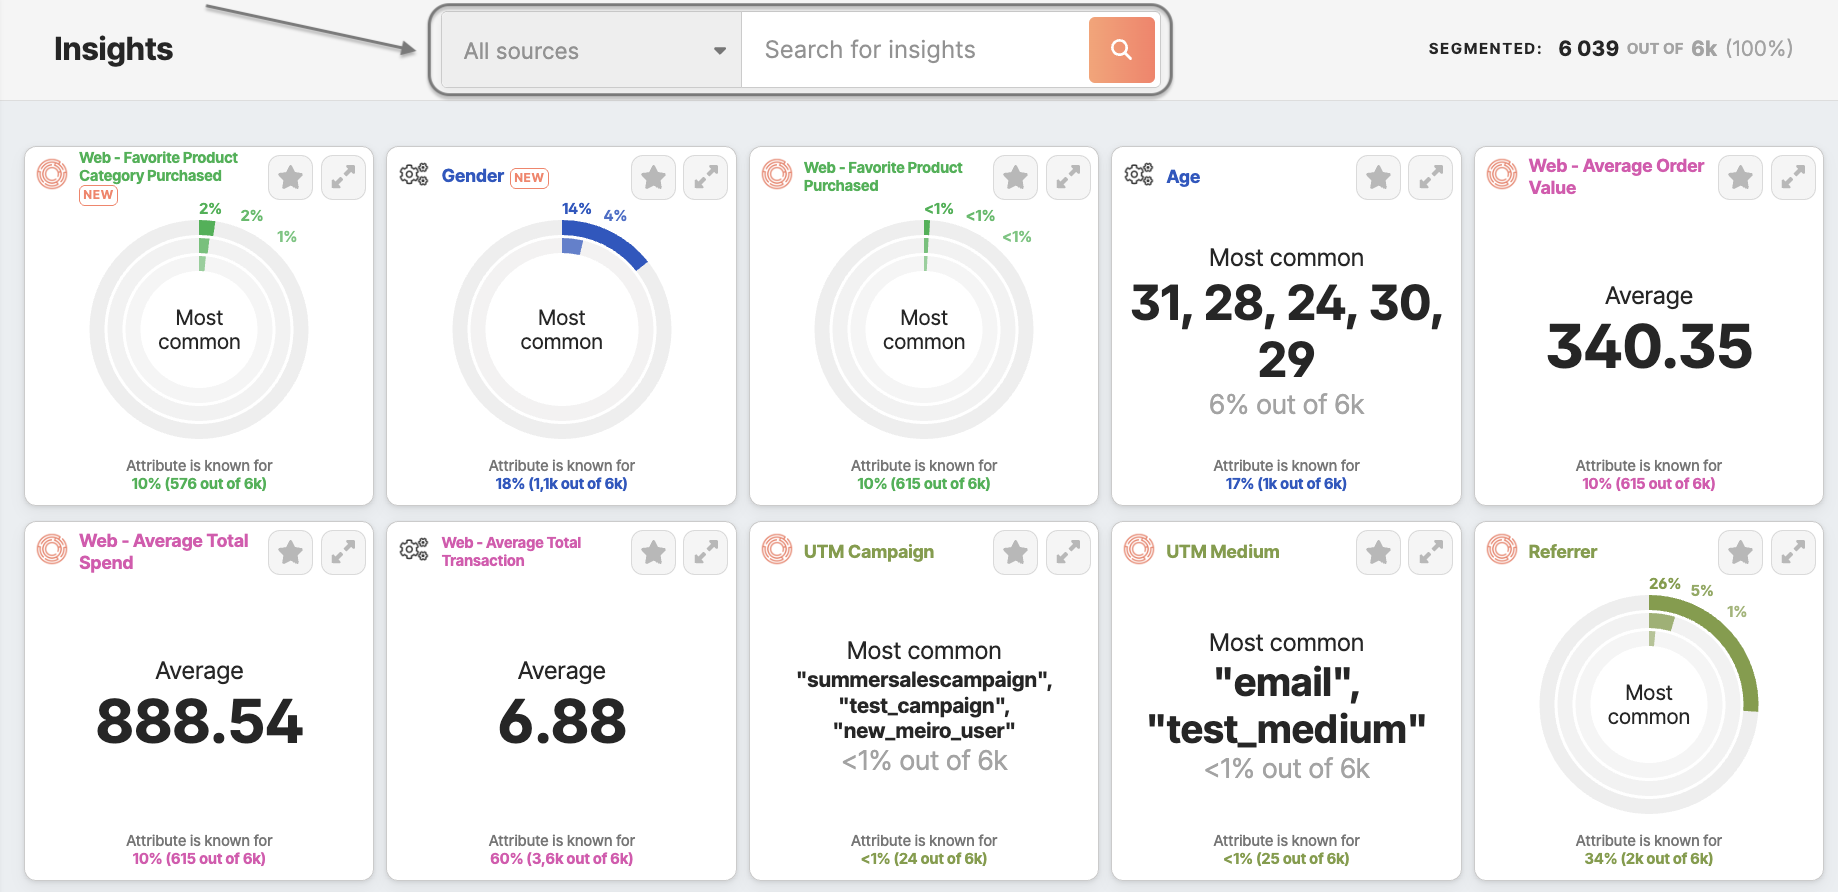
Insights tab
Insights for all the customer profiles databases are in the Analytics/ Insights tab. Insights for each segment are in the Segment Detail/ Insights tab.
Search through insights:
- By name
- By data source of the attribute, the insight is calculated from

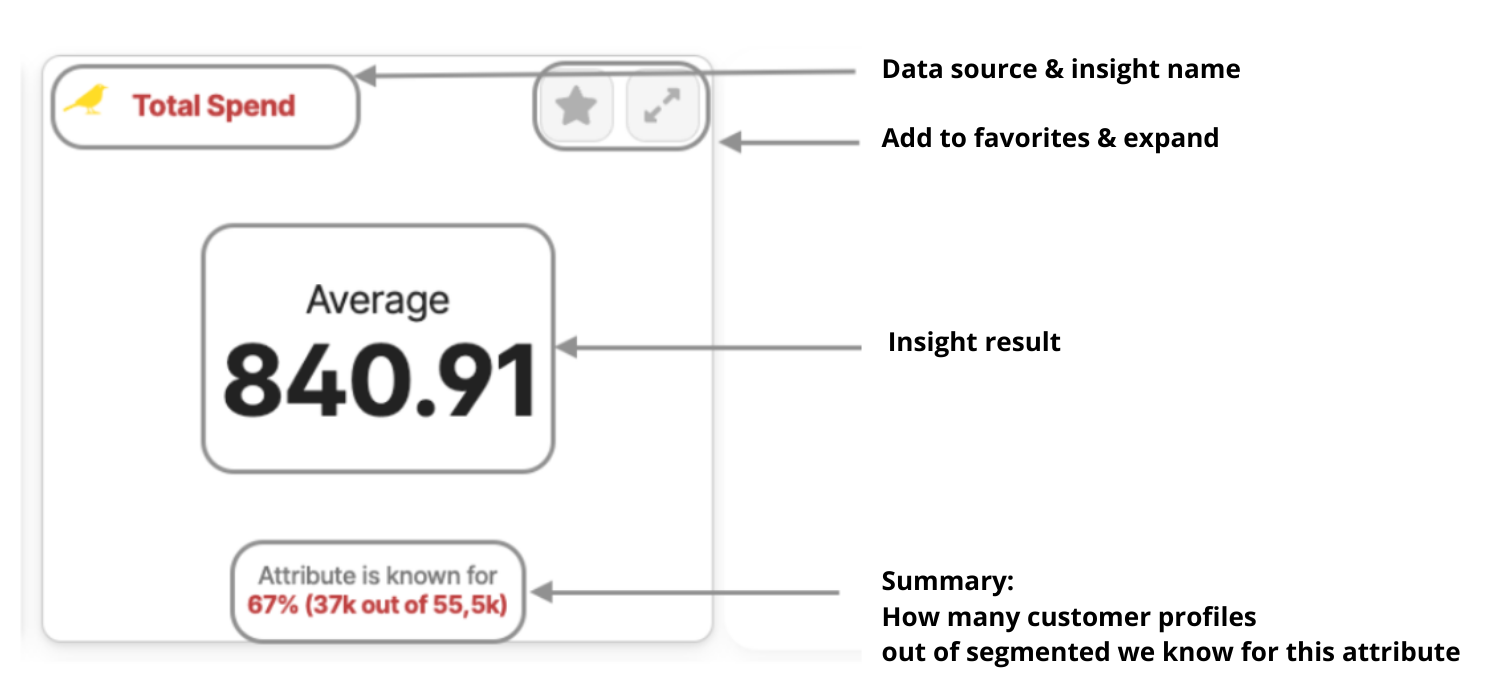
See how many customer profiles your insights are calculated for:
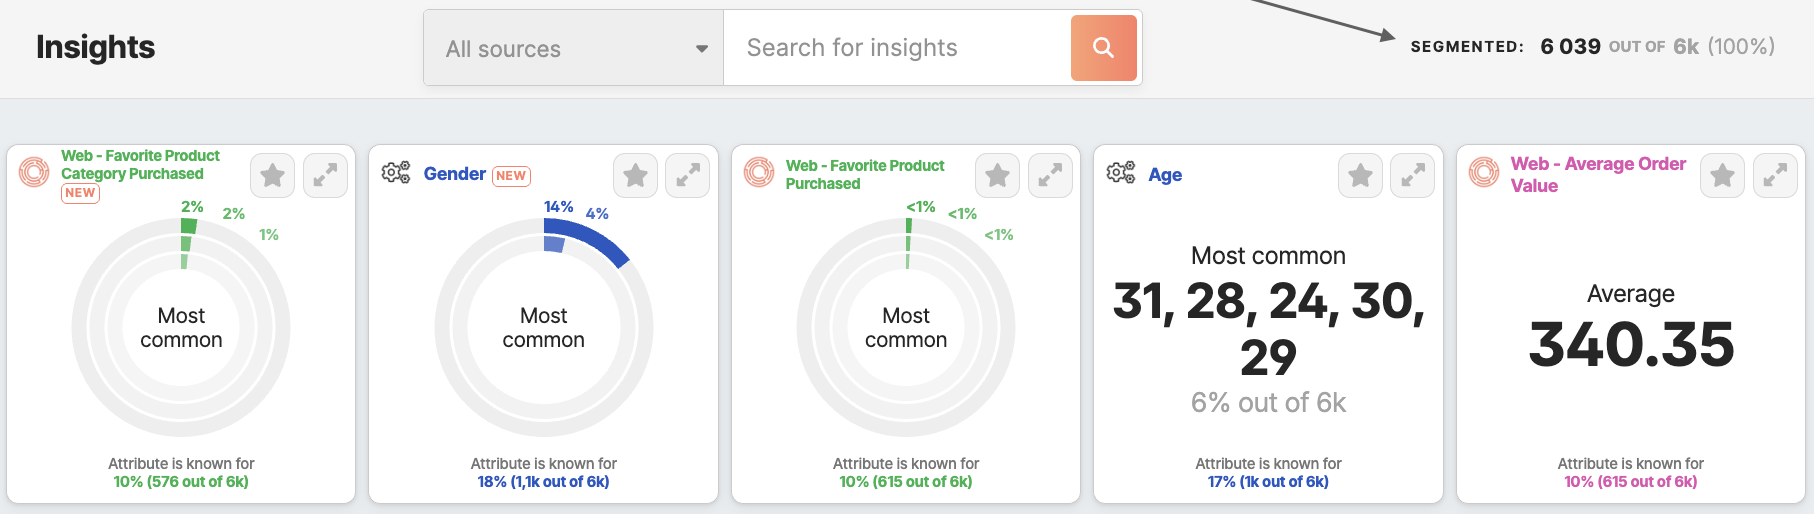

Learn more: what are insights and how do they work.
Reporting tab
The Reporting tab is set by the Meiro team in an external tool (Metabase).
Basic dashboards are available for each client within Meiro Business Explorer, as well as customized dashboards at additional costs. To learn more, please get in touch with the Meiro team.
If reporting is set and ready to use, it will be visible under the Reporting tab.
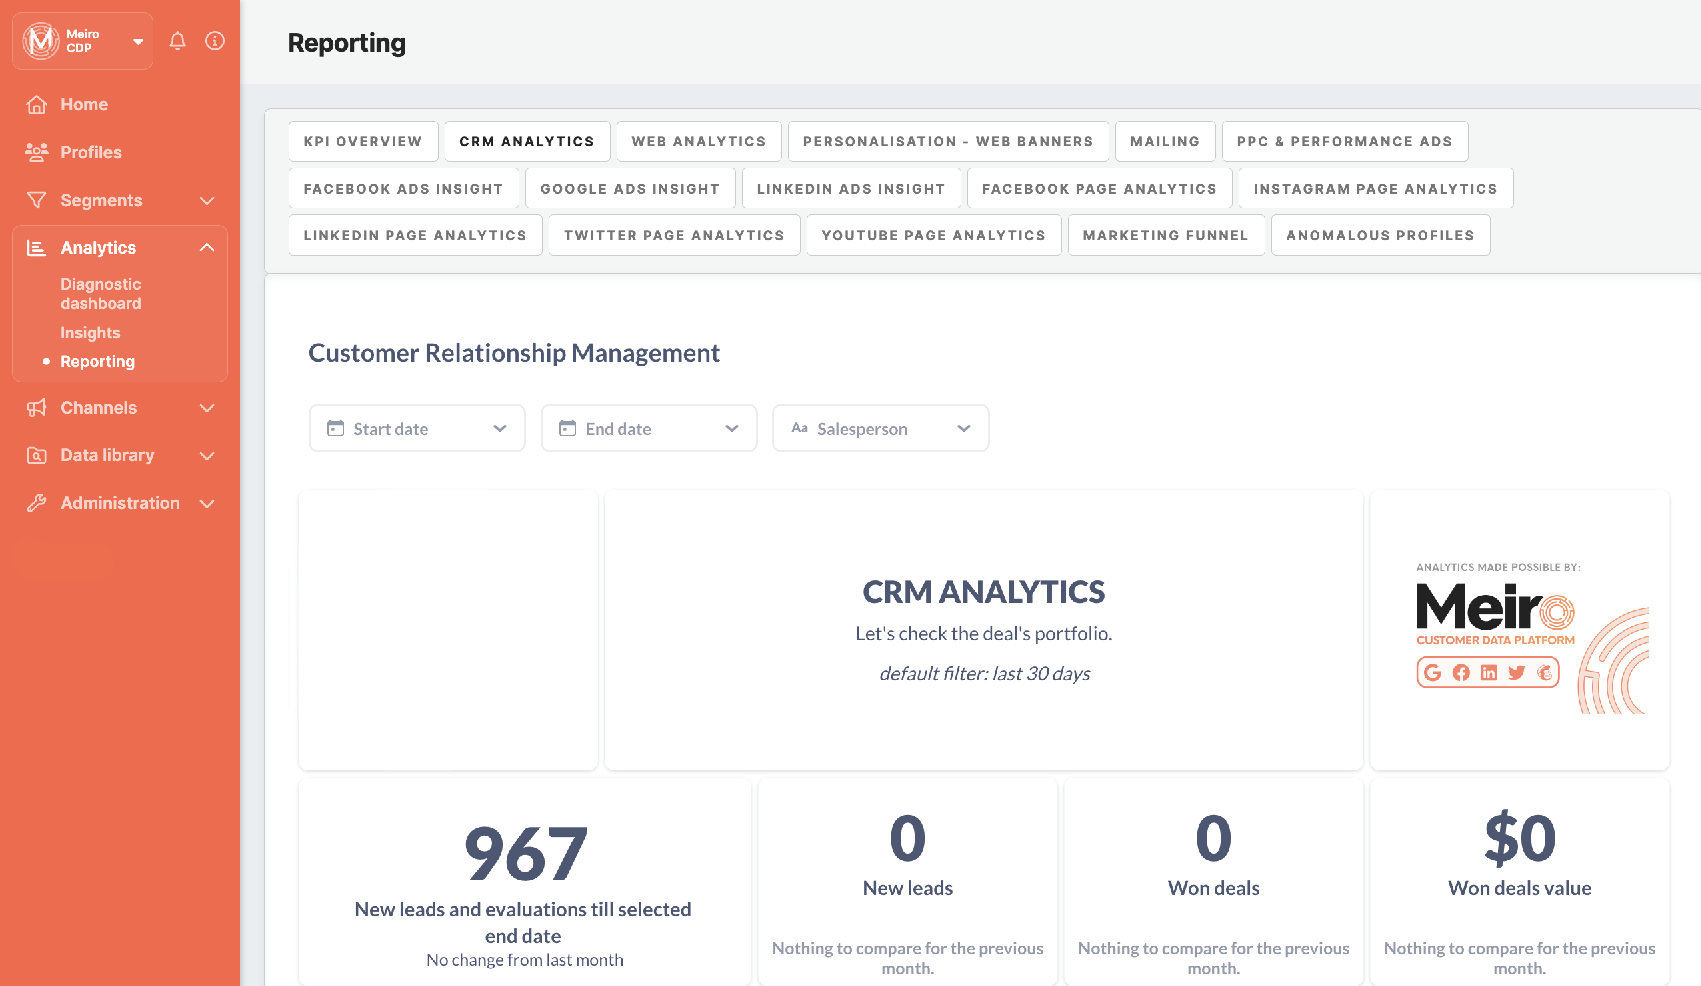
Learn more: about available reporting dashboards templates. Please remember that reporting can be customized to clients' needs and data. To learn more, contact the Meiro team.