Insights - what are they for and how do they work
Insights are a set of tiles with various analytics tiles.for segmented groups. Insights are built based on attributes and conditions (eg. most common location, device, count of customers that bought a product).
Insights are in:
- Data tab/ Insights tab
with insight valuesforyourthe whole customers'databasedatabase, - Segment Detail/ Insights tab
with insightsforeachsegmentedsegmentcustomers.

For each tile, you can see an expanded view of the tile that is slightly bigger than an original tile, also it may containwith additional data that will help you to understand the meaning of the tile.
information.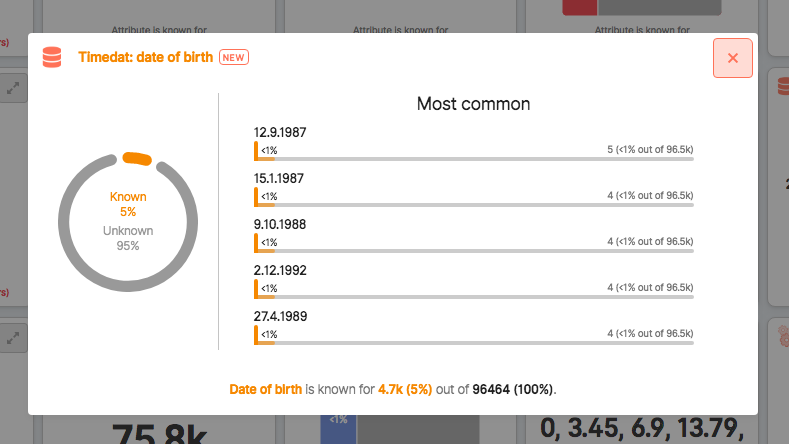
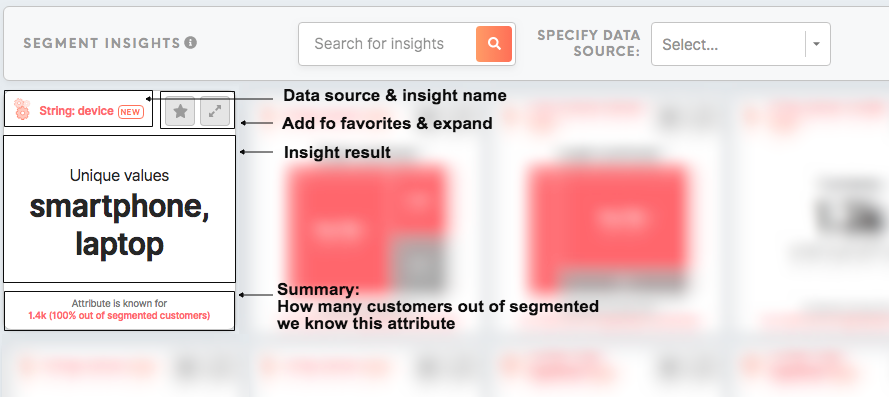
Each insight tile has a similar structure, it contains:
| |
What I can learn from my insights and what I canto do with that knowledgeit
With insights, you can quickly dive into analytics of your segmented audience, as well as the whole customer's dataset.
Depending on your marketing objectives and strategy it can be data connected to your revenue (average spending, max-min spending), customer engagement (highly engaged customers across the channels or within a particular channel), customer behaviour (most common URLs clicked, common locations, devices) and any other attribute that is available for your dataset.
Simply define what data matters to you, setting this up lays within clicks away.
Knowing this will help you quickly understandUnderstand your customers' behaviour that matters to you across data sources better, which will improve your marketing strategies.
You may learn about behaviour that will inspire you to build other segments for your perfect audience.
Most common use cases:
- Checking data quality (eg. whether segment contains a lot of customers with known PII/ with permission to contact).
- Checking best channel for activation (eg. channel with the highest engagement).
- Measure campaign performance (eg. most common UTM source/medium/campaign that brings web visitors).
- Identify the most common devices/country/OS which are useful for targeting.
Simply define with the Meiro team what data matters to you, setting it up lays within clicks away.