How data flow and components work
In this article, we explain how the folder structure and execution model works in Meiro Integrations.
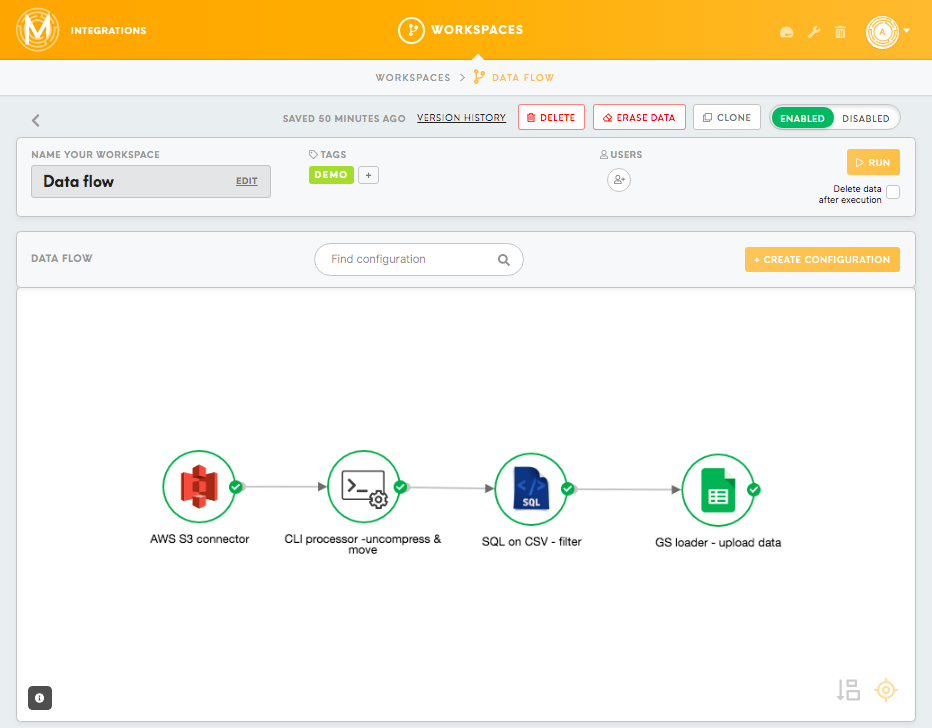
In Meiro Integrations, each workspace has its own data flow. The data flow displays a visual representation of the data loaded into Meiro Integrations, processed through processors and finally loaded to a data warehouse or optimised for a BI tool. Each data flow is presented as a DAG (Directed Acyclic Graph).
When creating the data flow, use components (nodes in the graph) that either connect to the data source (connectors), process the data (processors) or load data to your chosen data destination (loaders). Arrows between the components show which direction the data is flowing and how components are connected to each other.
You can read more about connectors, processors, loaders, components in the articles available online.
In the example below, we will demonstrate a data flow that:
- Downloads the table(s) from the AWS S3 bucket.
- Uncompresses the data and moves it to the
`tables`tablesfolder. - Filters the data.
- Uploads the data to a Google Spreadsheet.
Variables

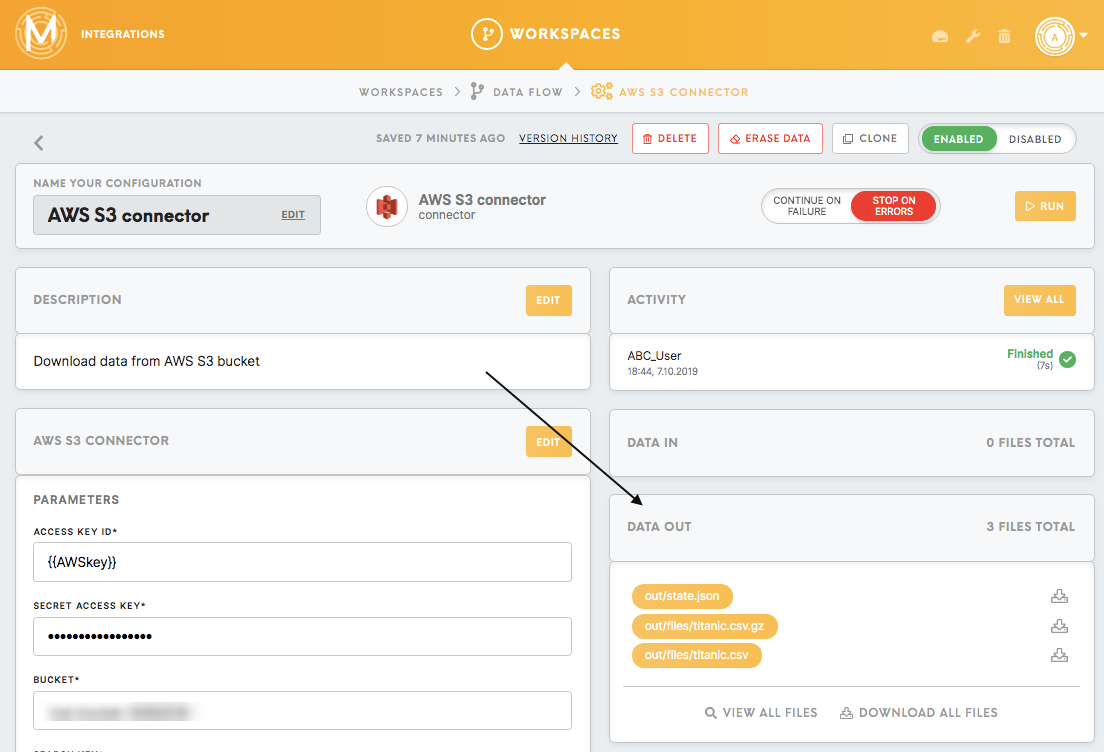
As you may want to change the Access Key to your AWS account, it is possible to set up variables for the workspace. This allows changing defined variables, without the need of adjusting all the credentials where the variables are mentioned.
You can refer to variables in the configurations putting their name in double curly braces: `{{name_of_variable}}.`
As you may want to change the Access Key to your AWS account, it is possible to set up variables for the workspace. This allows changing defined variables, without the need of adjusting all the credentials where the variables are mentioned.
You can refer to variables in the configurations putting their name in double curly braces: `{{name_of_variable}}`.
For more details about variables refer to the article.
Folder structure
There are `in`in (input) and `out`out (output) folders for each component. Each folder contains contains 'tables'tables (valid CSV datasets) and/or 'files'files (for any other type of file different than a table). The structure looks like this: ``/data/
|__ in/
    |__ tables/
    |__ files/
|__ out/
    |__ tables/
|__ files/``
More about the folder structure can be found here.
Download the data
Set up the AWS S3 connector, fill out the credentials and run the configuration. The connected data will show up in the Data Out bucket, in the folder `out/ All the files and folders in the files`.files.`out`out folder of the one component,component will be accessible by the following component in the the ``in``in folder (in this case `in/).files`files
Decompress and move the file
It is possible to use the filter for the Data In bucket if you wish to filter only the certain files (with the particular extension, or from the particular folder). In this example, we will filter only files with `GZ`GZ in naming, using `*. expression. Files will be decompressed using the Command Line Interface processor.gz`gz
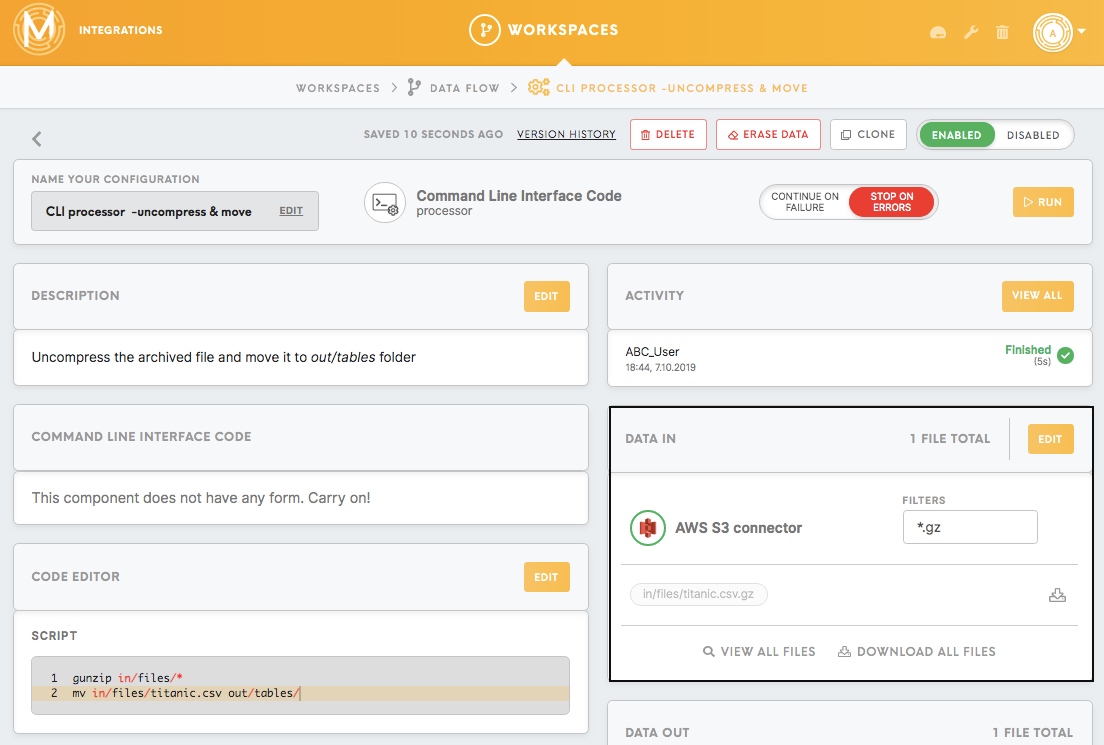
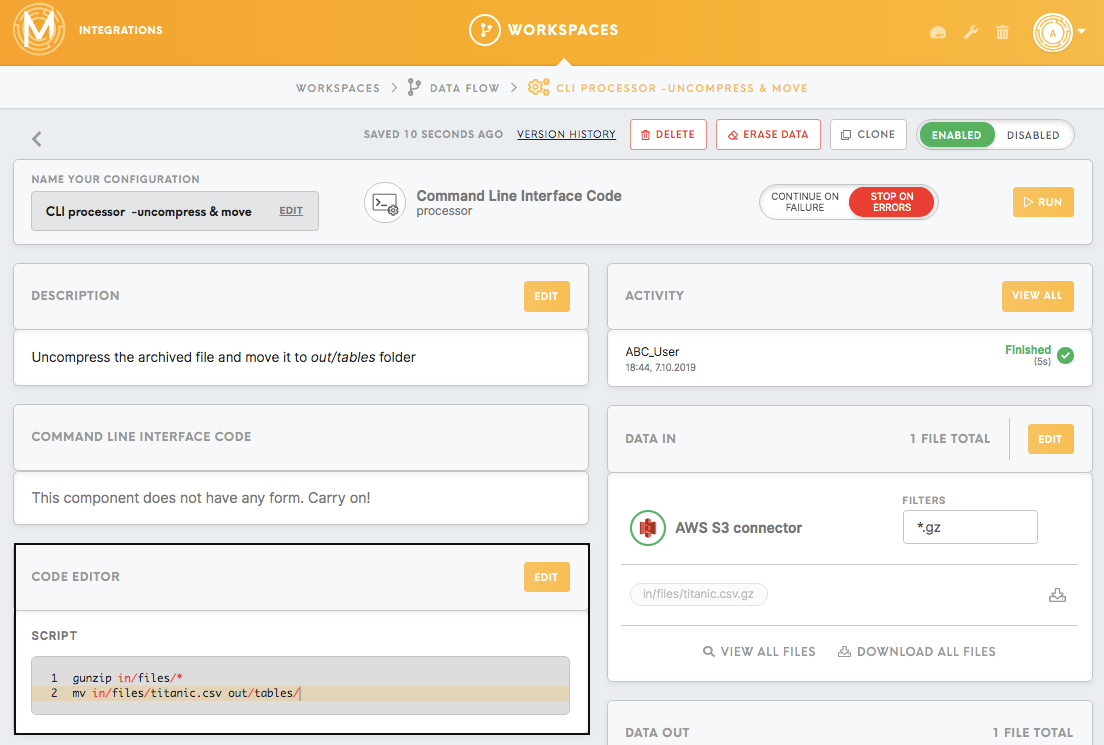
To decompress the file you need to run `gunzip in/files/* bash script which decompresses all the unzipped files in ``in/ folder.files`files
It is important to mention that not all of the processors move the data from the `data/ to the in`in`data/ automatically. Sometimes you need to do it yourself using the script accordingly to the requirements of the next component in your data flow.out`out
In this exampleexample, we use a bash script to move the decompressed file `titanic.csv`csv from the `in/ to the files`files`out/.tables`:tables: `mv in/files/titanic.csv out/tables/`
As a result, we will see the titanic.csv file in the out/tables folder.

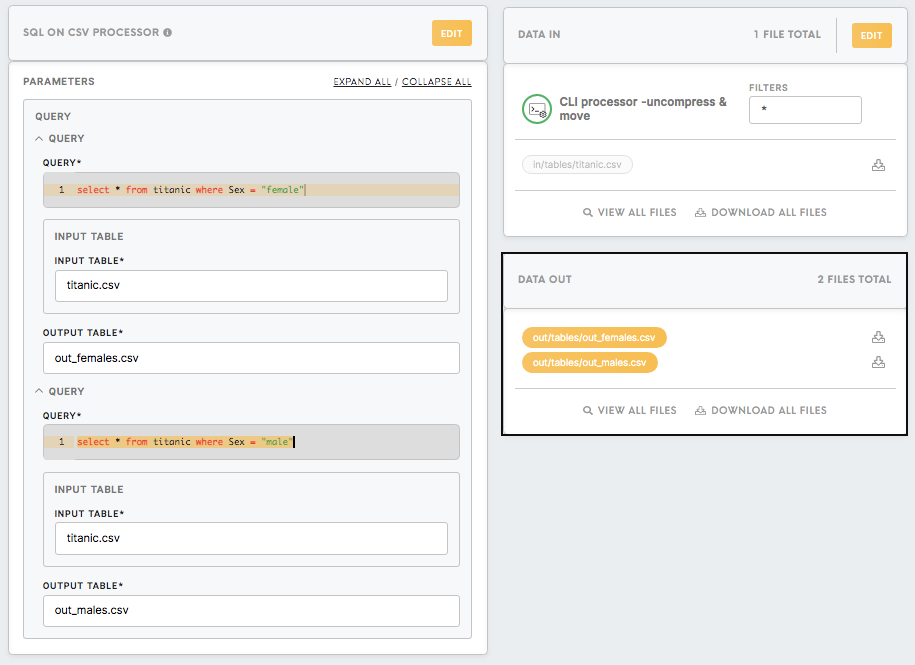
Filter the data in the table
In SQL on CSV processor, we filter the titanic dataset using the simple SQL query select * from titanic where Sex = "female" and select * from titanic where Sex = "male".
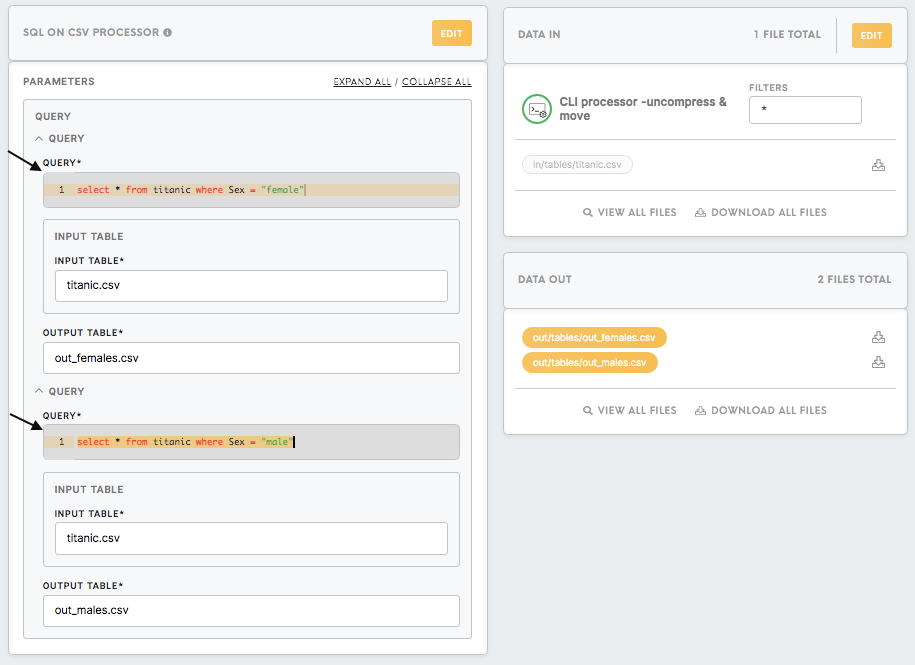
After running the configuration all the results will be saved in the out/tables folder.
Upload the data
After processing the data usually, you need to upload it to a final destination (DWH, cloud storage, etc.)
In this example, we upload the processed data to the Google Spreadsheet using the Google Spreadsheet loader component. Before setting up the configuration you need to authorize Meiro Integrations to access your Google account. After you set up and run the configuration you will see the results in the spreadsheet you defined. The Data Out bucket will be empty as the output for the loaders is always a third-party platform.
