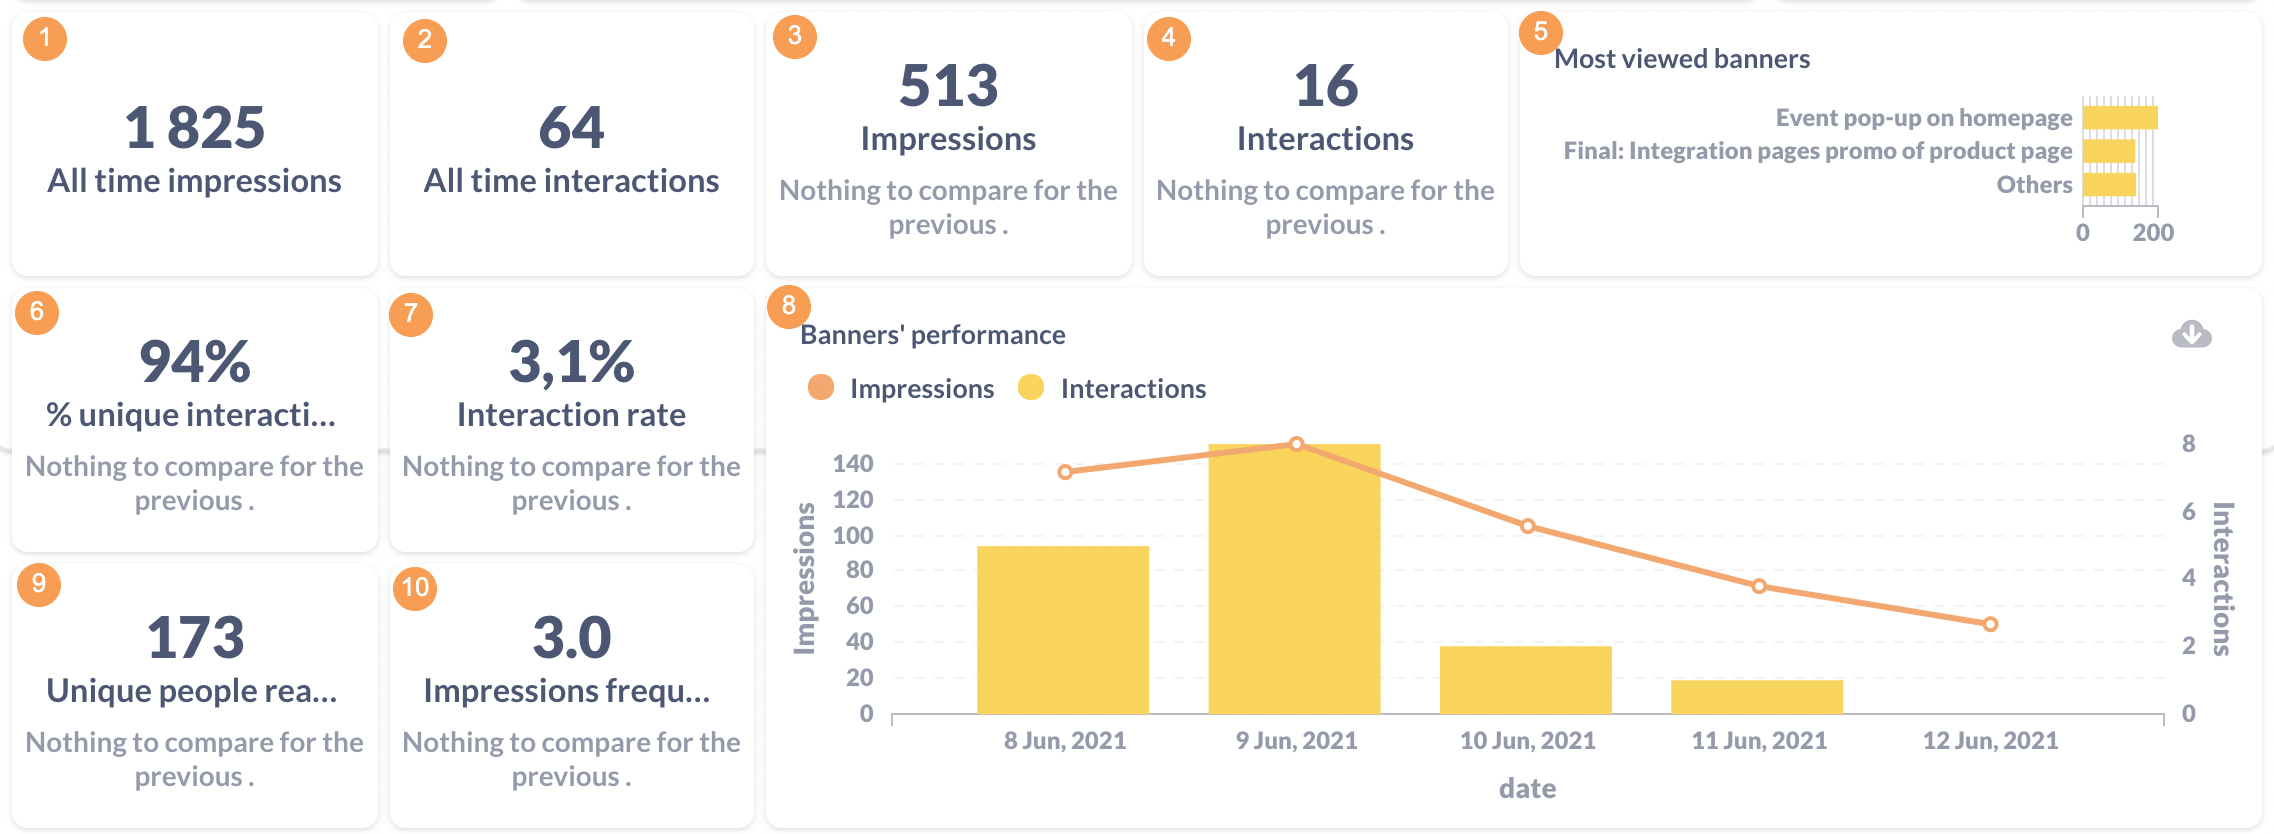
Web: reporting on banner performance
|
Prerequisites To work with 1. Meiro Events must be implemented. 2. Meiro Events API connection must be set in the Administration/ 3. Channels/Web 4. |
| Timeframe | Select the timeframe for reporting |
| Select the |
|
All impressions |
The lifetime number of impressions. Filterable by the |
|
All interactions |
The lifetime number of interactions. Filterable by the |
|
Impressions |
It is the number of impressions for the selected period. Filterable by the start date, end date, and the |
|
Interactions |
It is the number of interactions for the selected period. Filterable by the start date, end date, and Choose week or month and compare: set week with the previous one, or set month with the previous one. |
|
Impressions per visitor |
It is the number of impressions multiplied by the number of visitors. Filterable by start date, end date, and banner. The default period is 30 days. Choose week or month and compare: set week with the previous one, or set month with the previous one. |
|
% Interaction per user |
It is the percentage of interactions from impressions in the selected period. Filterable by start date, end date, and banner. Choose week or month and compare: set week with the previous one, or set month with the previous one. |
|
Unique users reached |
The number of unique users reached for the selected period. Filterable by the start date, end date, and the |
|
Transactions |
It is the number of transactions in the selected period. Filterable by start date, end date, and banner name and status. Choose week or month and compare: set week with the previous one, or set month with the previous one. |
|
Most viewed banners |
In the selected period, it is the number of impressions per |
|
Most interacted banner |
It is the most interacted |
|
% Unique interactions |
It is the percentage of interactions that unique users have made in the selected period. 100% means that individual users have made all interactions. Filterable by the start date, end date, and |
|
Revenue |
It is the sum of orders' values in the selected period where a banner has been clicked in the last 24 hours. Filterable by start date, end date, and banner name and status. Choose week or month and compare: set week with the previous one, or set month with the previous one. |
|
Banners’ performance time |
Time series for the number of impressions and interactions in the selected period. Filterable by the start date, end date, and |
|
Funnel |
Funnel from impressions to interaction in the selected period.Filterable by the start date, end date, and |
|
Data acquisition banners completion |
It is the number of a specific sum of interactions per banner in the selected period. Specific interaction means a custom action, for example, an answer to a question or adding additional customer information. Filterable by start date, end date, and banner. |
|
Banners run time in days |
It is the number of days with at least one impression of the banner. Filterable by banner and status. |
|
Banners performance |
It is the time series for the number of impressions and interactions in the selected period. Filterable by the start date, end date, and |


