ePrivacy and GPDR Cookie Consent by Cookie Consent Skip to main content

Web banners: reporting on web banner performance
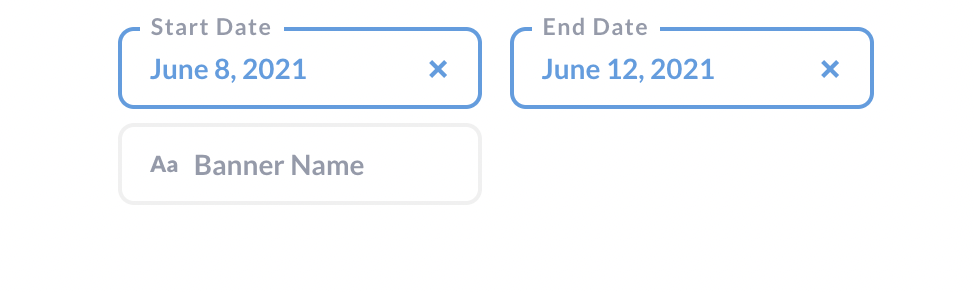
Web banners performance can be tracked in the Reporting tab (it has to be set by the Meiro team).


image-1624017161092.png

Timeframe Select timeframe for reporting
Web banner name Select web banner name to check performance of a particular web banner. Otherwise reporting will be displayed for all web banners in total.
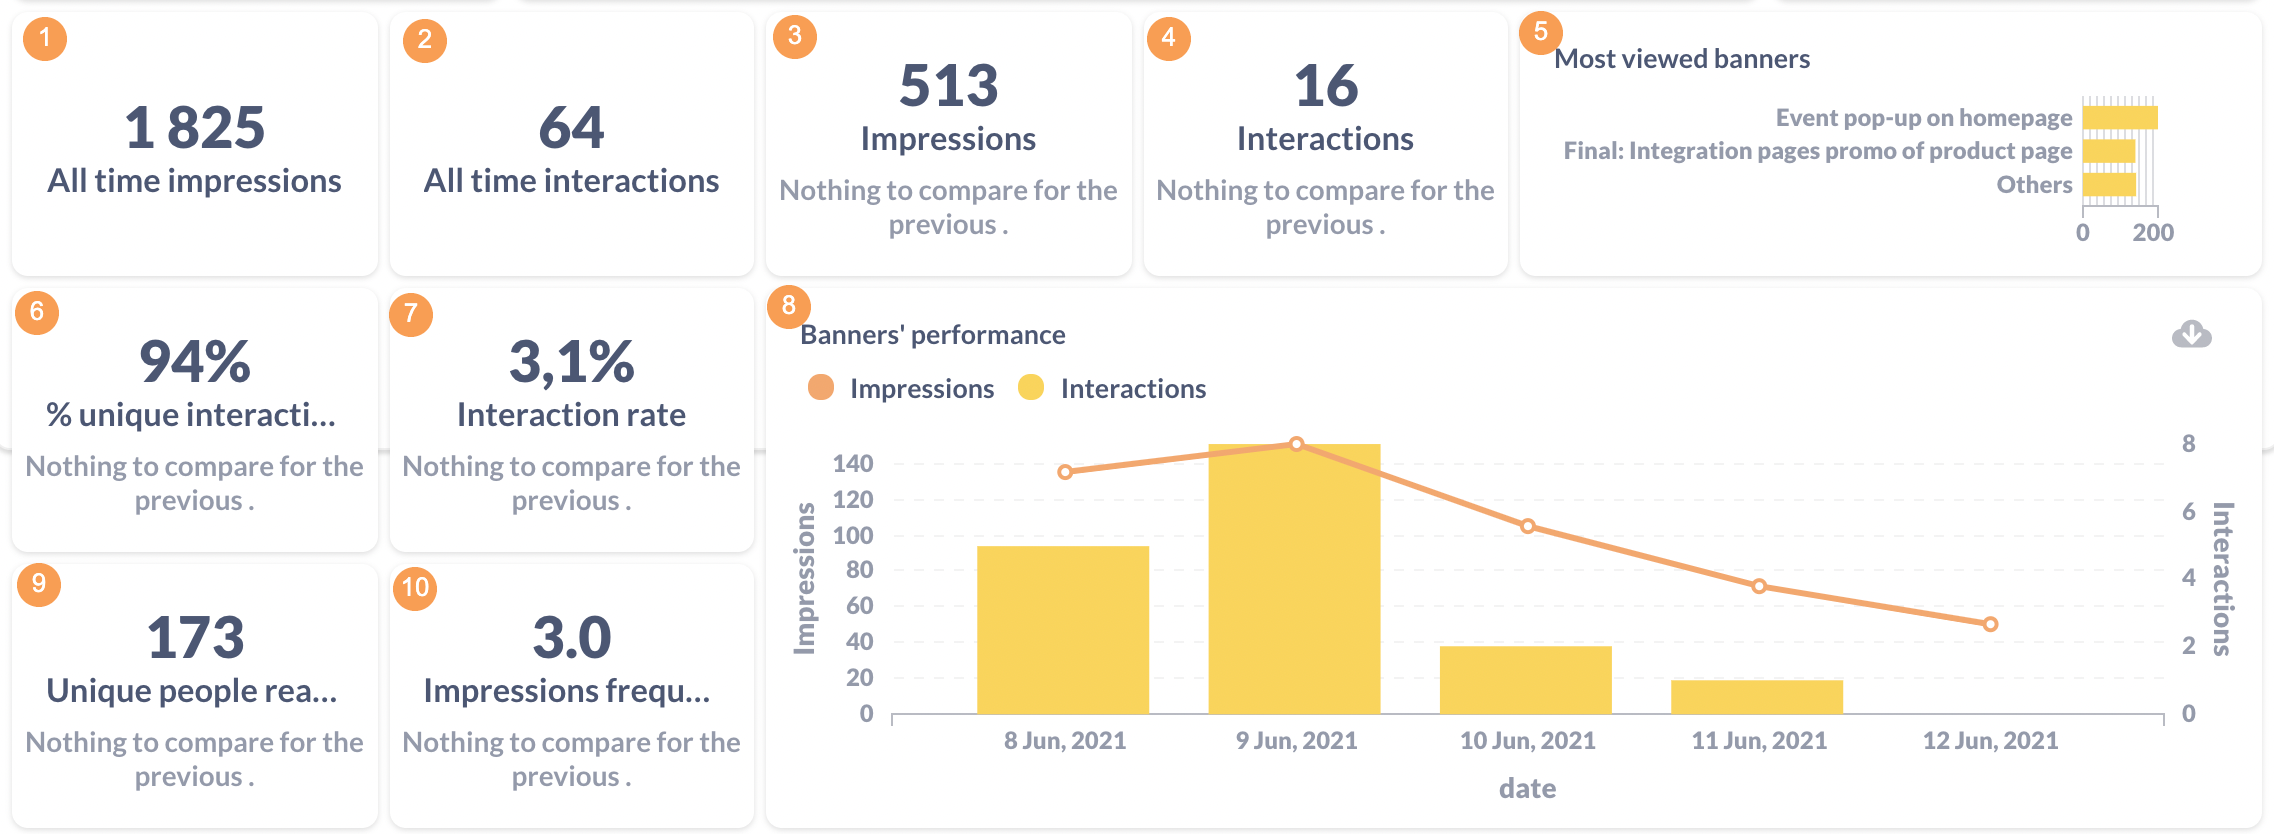


image-1624017090758.png

1

All impressions

All time

The impressions

Totallifetime number of impressions lifetime.impressions. Filterable by the web banner.

2

All interactions

All time

The interactions

Totallifetime number of interactions lifetime.interactions. Filterable by the web bannerbanner.

3

Impressions

NumberIt is the number of impressions for the selected period. Filterable by the start date, end datedate, and the web banner.banner, 

Whenthe choosing a timedefault period asis 30 days. Choose week or month,month thenand thecompare: trend comparesset week with the weekprevious beforeone, theor chosen period,set month with the monthprevious before the chosen period. one.

4

Interactions

NumberIt is the number of interactions for the selected period. Filterable by the start date, end datedate, and web banner. banner, the default period is 30 days. The default period is 30 days.

When choosing a periodChoose week or month,month thenand thecompare: trend comparesset week with the weekprevious beforeone, theor chosen period,set month with the monthprevious before the chosen timeframe. one.

5Most viewed banners

Number of impressions per web banner in the selected period.  Filterable by the start date, end date and web banner.

Calculated as the number of impressions grouped by the web banner name. 

6 %

Impressions uniqueper interactionsvisitor

ShowingIt is the percentagenumber of interactionsimpressions which have been mademultiplied by unique users in the selectednumber period. 

of

100% means that all interactions have been made by unique users. visitors.

Filterable by the start date, end date, weband banner. The default period is 30 days.

When choosing a periodChoose week or month,month thenand thecompare: trend comparesset week with the weekprevious beforeone, theor chosen period,set month with the monthprevious beforeone.

the chosen timeframe.


7

% Interaction per user

% interaction rate

PercentageIt is the percentage of interactions from impressions in the selected period. Filterable by the start date, end datedate, and web banner. Calculated as the number of interactions multiplied by the number of impressions.

When choosing a periodChoose week or month,month thenand thecompare: trend comparesset week with the weekprevious beforeone, theor chosen period,set month with the monthprevious before the chosen timeframe.one.


8 Banner's

Unique performanceusers reached


Time series forThe number of impressionsunique andusers interactionsreached infor the selected period.

Filterable by the start date, end datedate, and web banner.banner, the default period is 30 days. Choose week or month and compare: set week with the previous one, or set month with the previous one.


Transactions

It is the number of transactions in the selected period. Filterable by start date, end date, and banner name and status. Choose week or month and compare: set week with the previous one, or set month with the previous one.

9 Unique

Most peopleviewed reachedbanners

Number of unique users reached forIn the selected period.period,

it

is the number of impressions per web banner grouped by the web banner name.  Filterable by the start date, end
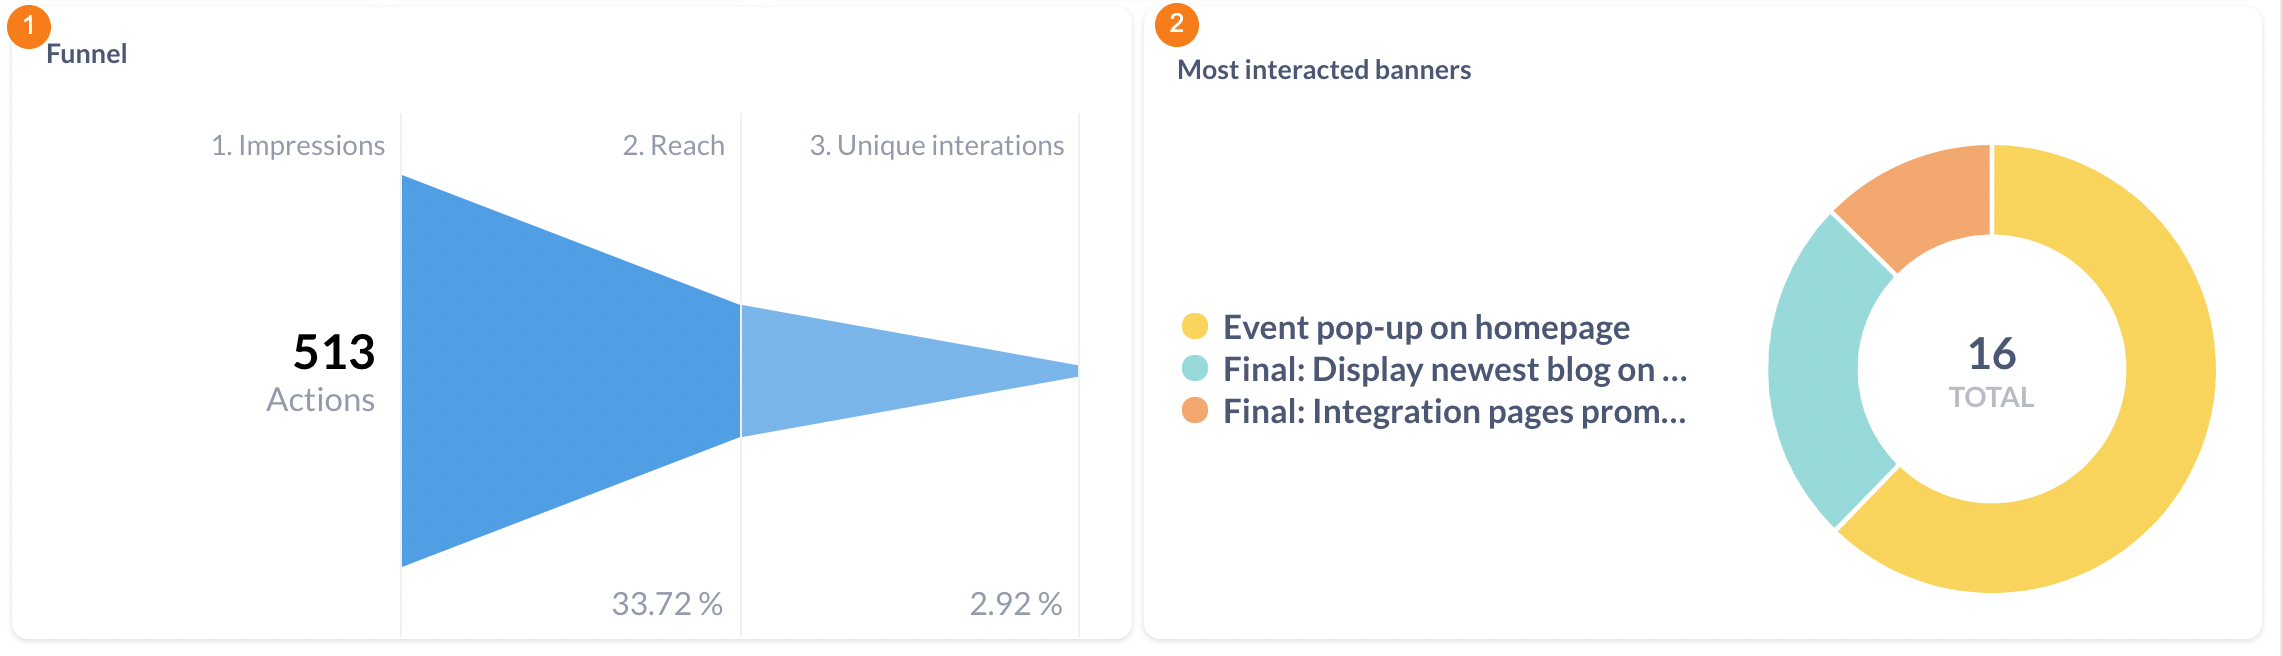
 datedate, and web banner. 

WhenThe choosing adefault period weekis or30 month, then the trend compares week with the week before the chosen period, month with the month before the chosen timeframe.days.

10 Impressions

Most frequencyinteracted banner

NumberIt is the most interacted web banner (sum of impressionsinteractions) dividedin bythe numberselected ofperiod. unique users. Calculated as number of impressions multiplied as number of visitors.

Filterable by the start date, end datedate, and web banner.  The default period is 30 days.

When% choosingUnique ainteractions

It is the percentage of interactions that unique users have made in the selected period. 100% means that individual users have made all interactions. Filterable by the start date, end date, web banner. The default period is 30 days. Choose week or month,month thenand thecompare: trend comparesset week with the weekprevious beforeone, theor chosen period,set month with the monthprevious before the chosen timeframe.one.

image-1624017094654.png


1 Funnel

Revenue

It is the sum of orders' values in the selected period where a banner has been clicked in the last 24 hours. Filterable by start date, end date, and banner name and status. Choose week or month and compare: set week with the previous one, or set month with the previous one.

Banners’ performance time

Time series for the number of impressions and interactions in the selected period. Filterable by the start date, end date, and web banner. The default period is 30 days.

Funnel

Funnel from impressions to interaction in the selected period.

Filterable by the start date, end datedate, and web banner. The default period is 30 days.


Data acquisition banners completion

It is the number of a specific sum of interactions per banner in the selected period. Specific interaction means a custom action, for example, an answer to a question or adding additional customer information. Filterable by start date, end date, and banner. 

2 Most

Banners interactedrun bannerstime in days

TheIt mostis interactedthe webnumber bannersof days with at least one impression of the banner. Filterable by banner and status.

Banners performance

It is the time series for the number of impressions and interactions in the selected period.Calculated as sum of the interactions.

Filterable by the start date, end datedate, and web banner.  The default period is 30 days.