Web banners: reporting on web banner performance
| Timeframe | Select timeframe for reporting |
| Web banner name | Select web banner name to check performance of a particular web banner. Otherwise reporting will be displayed for all web banners in total. |
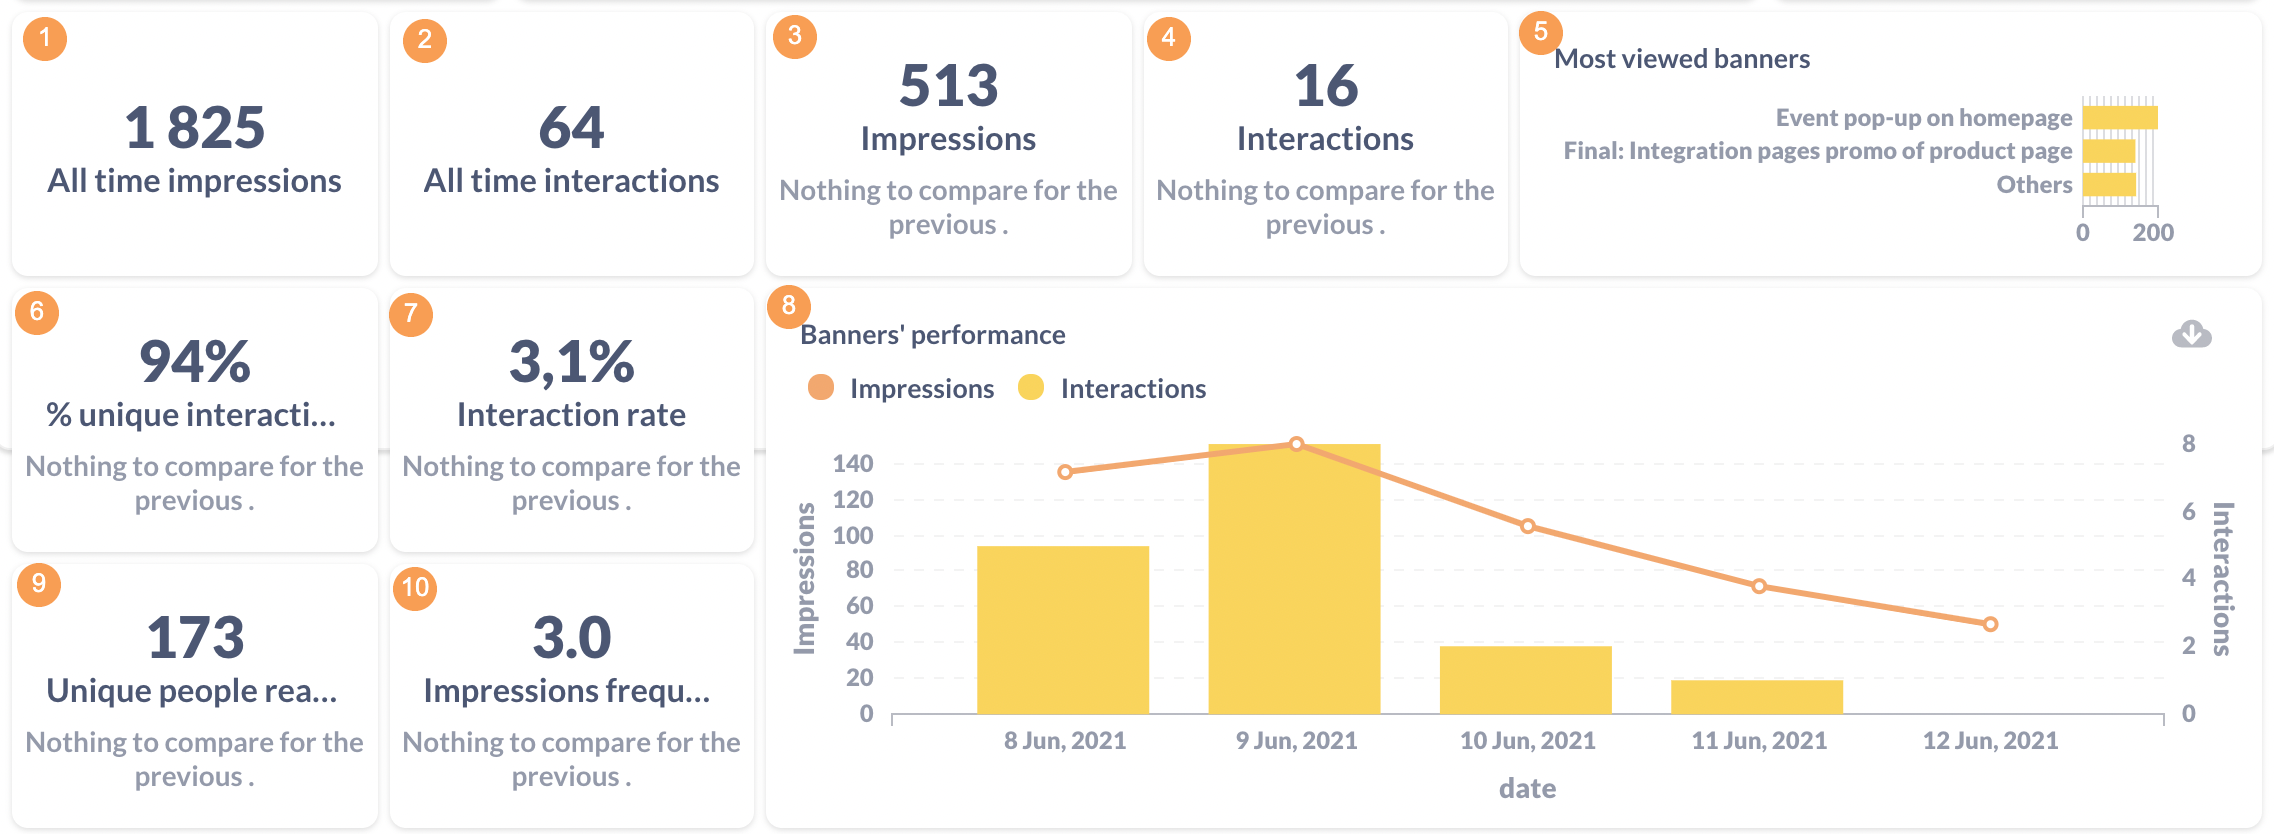
| 1 | All time impressions | Total number of |
| 2 | All time interactions | Total number of |
| 3 | Impressions |
Number of impressions for selected When choosing a time period as week or month, then the trend compares week with the week before the chosen period, month with the month before the chosen period. |
| 4 | Interactions |
Number of interactions for selected period. Filterable by the start date, end date and web banner. When choosing a period week or month, then the trend compares week with the week before the chosen period, month with the month before the chosen timeframe. |
| 5 | Most viewed banners | Number of impressions per web banner in the Calculated as the number of impressions grouped by the web banner name. |
| 6 | % unique interactions | Showing the percentage of interactions which have been made by unique users in the selected period. 100% means that all interactions Filterable When choosing a period week or month, then the trend compares week with the week before the chosen period, month with the month before the chosen timeframe. |
| 7 | % interaction rate |
Percentage When |
| 8 | Banner's performance | Time series for number of impressions and interactions Filterable by the |
| 9 | Unique people reached |
Number of unique Filterable by the start date, end date and web banner. When choosing a period week or month, then the trend compares week with the week before the chosen period, month with the month before the chosen timeframe. |
| 10 | Impressions frequency |
Number of impressions divided by number of unique users. Calculated as number of impressions multiplied as number of visitors. Filterable by the start date, end date and web banner. When choosing a period week or month, then the trend compares week with the week before the chosen period, month with the month before the chosen timeframe. |
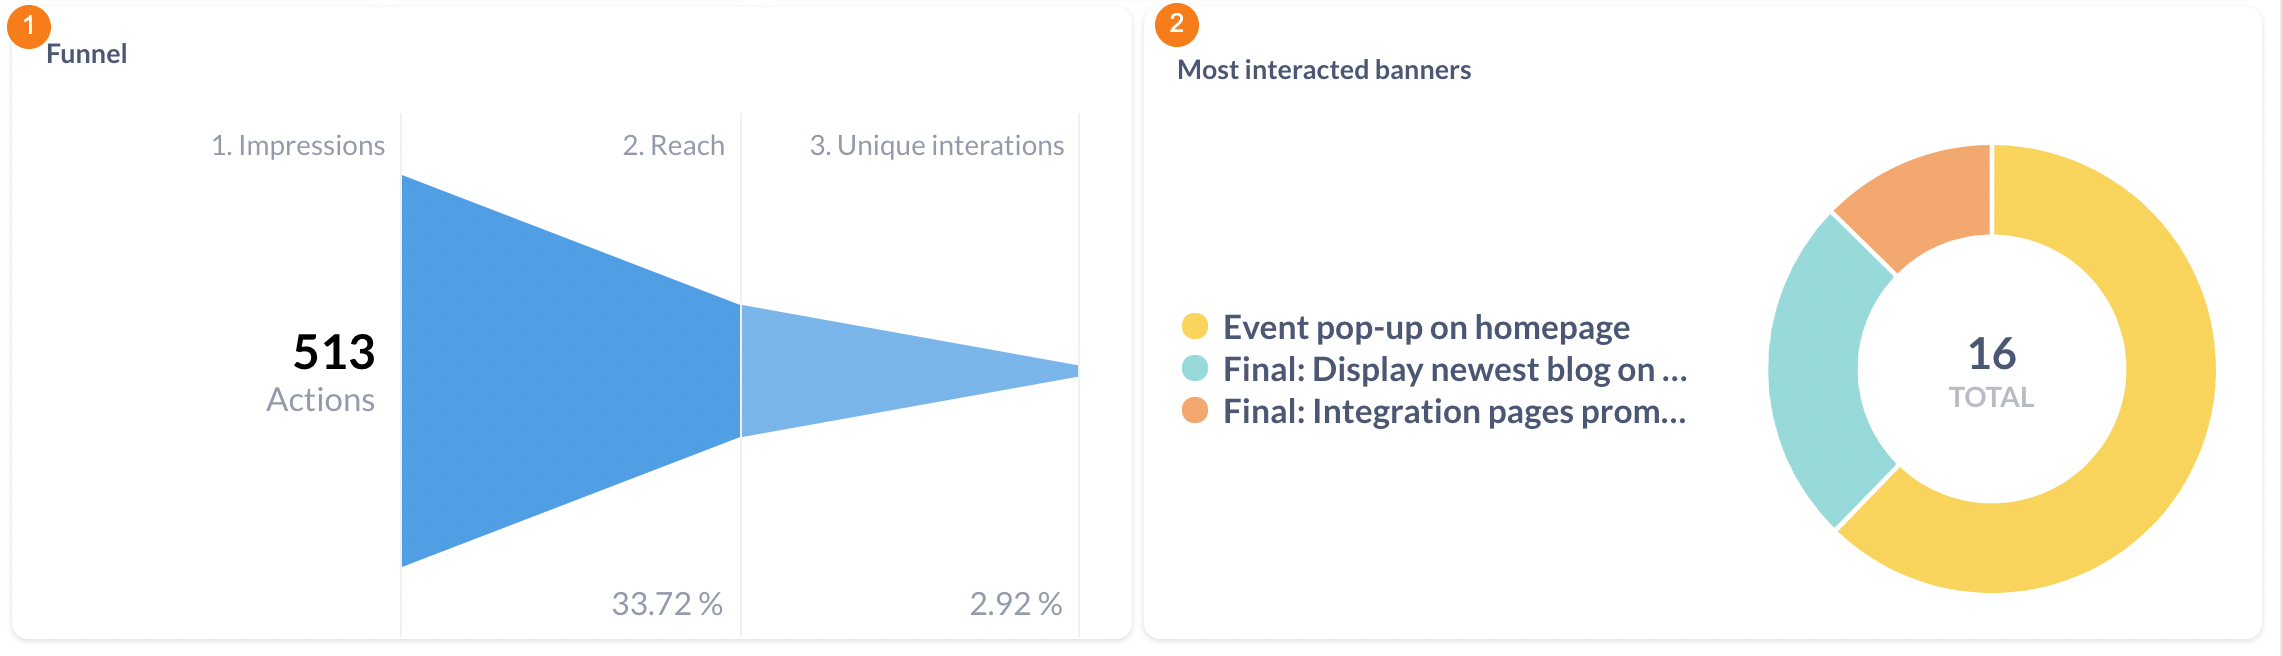
| 1 | Funnel | Funnel Filterable by the start date, end date and web banner. |
| 2 | Most interacted banners | The most interacted web Filterable by the start date, end date and web banner. |