|
All impressionsinteractions
|
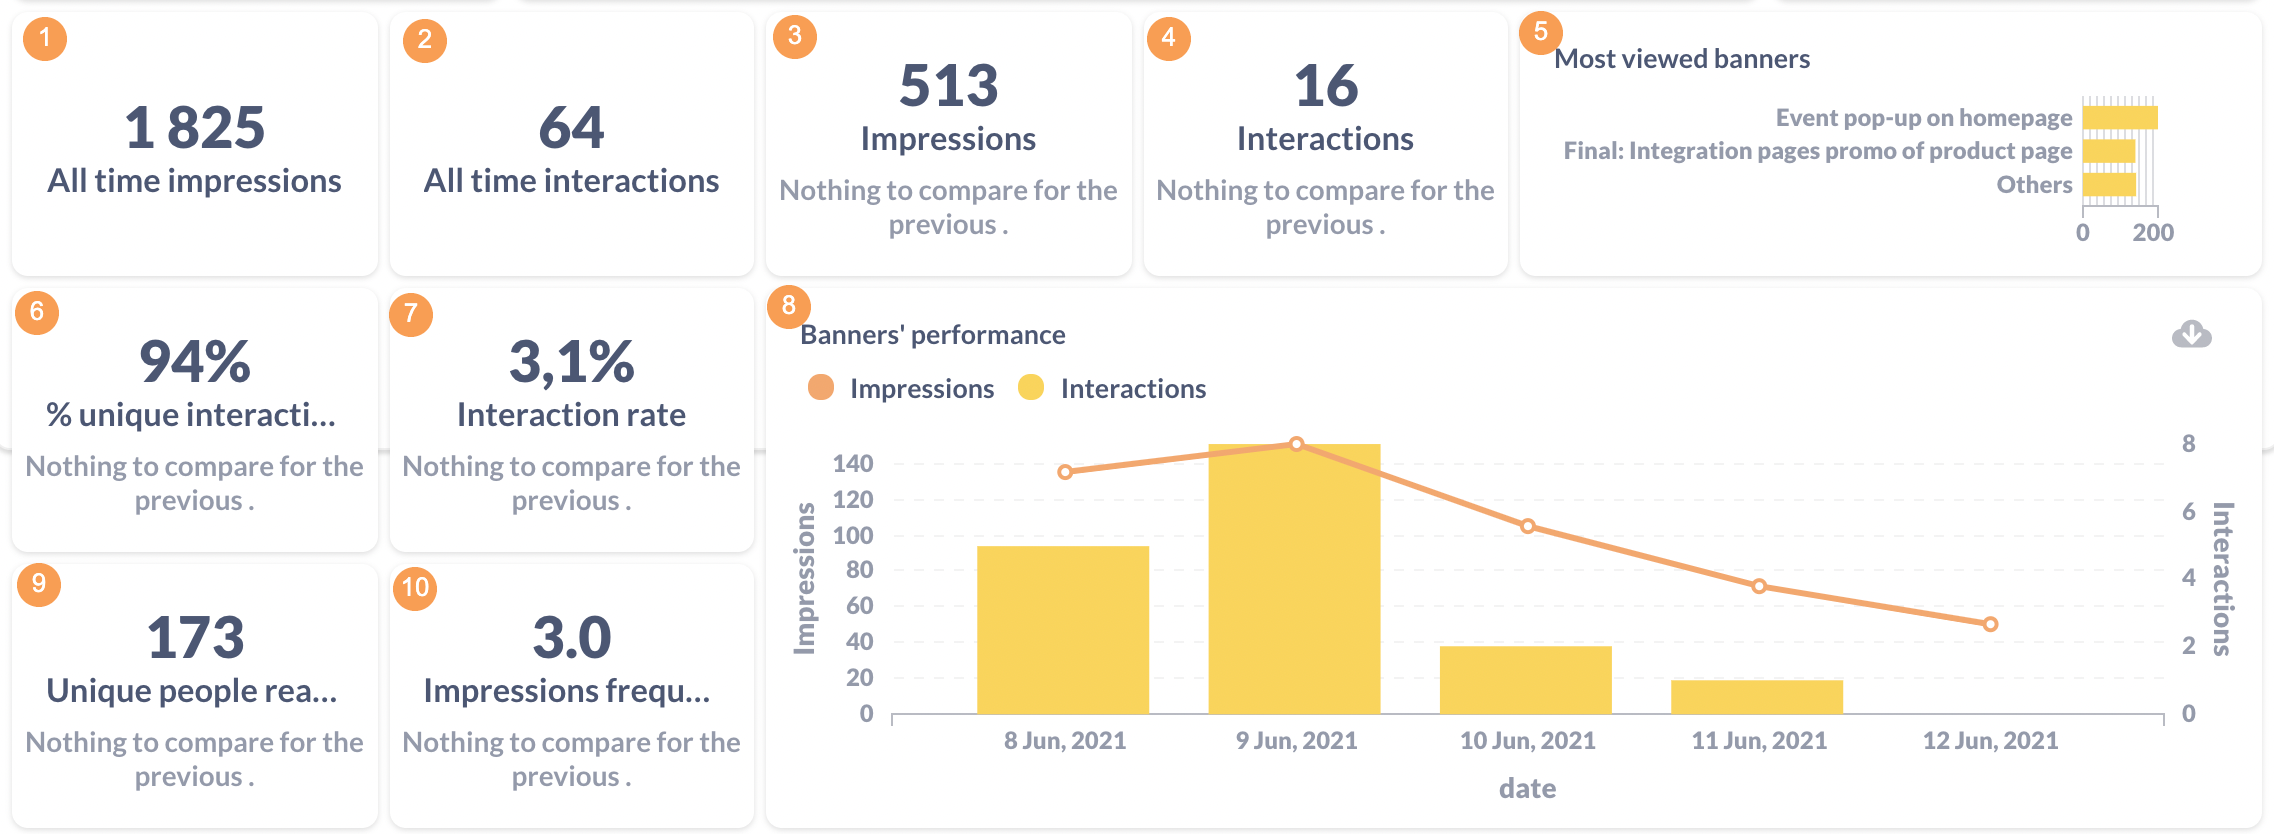
The lifetime number of impressions. Filterable by the banner.
|
All interactions
|
The lifetime number of interactions. Filterable by the banner.
|
|
Impressions
|
ItNumber isof impressions in the selected period.
Filterable by start date, end date and banner name, type and status.
When choosing a time period, week or month, then trend compares week with the week before that and month with the month before that.
|
|
Interactions
|
Number of interactions in the selected period.
Filterable by start date, end date and banner name, type and status.
When choosing time period week or month then trend compares week with the week before that and month with the month before that.
|
|
Impressions per user
|
Number of impressions per user in the selected period.
Filterable by start date, end date and banner name, type and status.
Calculated as number of impressions fordivided by number of visitors.
When choosing time period week or month then trend compares week with the week before that and month with the month before that.
|
|
Interactionsper user
|
Number of interactions per user in the selected period.
Filterable by the start date, end date,date and thebanner banner,name, type theand defaultstatus.
Calculated as number of interactions divided by number of users.
When choosing time period is 30 days. Choose a week or month andthen compare:trend setcompares week with the previousweek one,before orthat setand month with the previousmonth one.before that.
|
|
InteractionsTotal banners performance
|
ItShowing number of transactions and its revenue and AOV per banner as well as impressions, interactions, and most importantly conversion rate from impression to transaction in two attribution model windows (Same Session and Direct).
AOV is the Average order value calculated as a division between revenue and number of transactions.
CR is a conversion rate calculated as a division between interactions forand thenumber selectedof period.transactions.
CPI is a conversion rate calculated as a division between impressions and number of transactions.
Filterable by the start date,and end date, andbanner banner,name, the default period is 30 days. The default period is 30 days.
Choose week or monthtype and compare: set week with the previous one, or set month with the previous one.
status.
|
|
Impressions per visitorTransactions
|
It is the number of impressions multiplied by the number of visitors.
Filterable by start date, end date, and banner. The default period is 30 days.
Choose week or month and compare: set week with the previous one, or set month with the previous one.
|
% Interaction per user
|
It is the percentage of interactions from impressions in the selected period. Filterable by start date, end date, and banner. Choose week or month and compare: set week with the previous one, or set month with the previous one.
|
Unique users reached
|
The number of unique users reached for the selected period.
Filterable by the start date, end date, and the banner, the default period is 30 days. Choose week or month and compare: set week with the previous one, or set month with the previous one.
|
Transactions
|
It is the numberNumber of transactions in the selected period.
Filterable by start date, end date,date and banner namename, type and status.
ChooseWhen choosing time period week or month andthen compare:trend setcompares week with the previousweek one,before orthat setand month with the previousmonth one.before that.
|
|
Most viewed banners
|
In the selected period, it is the numberNumber of impressions per banner grouped byin the bannerselected name.period.
Filterable by the start date, end date,date and banner.banner Thename, defaulttype periodand isstatus.
30Calculated days.as number of impressions group by banner name.
|
|
Most interacted banner
|
It is the mostMost interacted banner (sum of interactions)banners in the selected period.
Filterable by the start date, end date,date and thebanner banner.name, Thetype defaultand periodstatus.
isCalculated 30as days.sum of interactions.
|
|
% Unique interactions
|
It is theShowing percentage of interactions thatwhich have been made by unique users have made in the selected period. 100% means that individualall usersinteractions havewere made allby interactions.unique users.
Filterable by the start date, end date,date and banner.banner Thename, defaulttype and status.
When choosing time period is 30 days. Choose week or month andthen compare:trend setcompares week with the previousweek one,before orthat setand month with the previousmonth one.before that.
|
|
Revenue (currency)
|
It is the sumSum of orders'prices valuesorders in the selected periodperiod.
where a banner has been clicked in the last 24 hours. Filterable by start date, end date,date and banner namename, type and status.
ChooseWhen choosing time period week or month andthen compare:trend setcompares week with the previousweek one,before orthat setand month with the previousmonth one.before that.
|
|
Banners’ performance in time
|
Time series for the number of impressions and interactions in the selected period.
Filterable by the start date, end date,date and banner.banner Thename, defaulttype periodand is 30 days.status.
|
|
Funnel
|
FunnelPercentages fromfor the specific steps within the funnel are always counted towards the total number of impressions to interaction in the selected period.
Filterable by the start date, end date,date and banner.banner Thename, defaultstatus periodand is 30 days.
type.
|
|
DataRevenue acquisitionper bannersuser completion(currency)
|
It is the number of a specificTotal sum of interactionsprices orders per banneruser in the selected period.
Specific interaction means a custom action, for example, an answer to a question or adding additional customer information. Filterable by start date, end date,date and banner.banner name, type and status.
Calculated as sum of orders divided by number of users.
When choosing time period week or month then trend compares week with the week before that and month with the month before that.
|
|
Banners run time in days
|
It is the number of days with at least one impression of the banner. Filterable by banner and status.
|
|
Banners performance
|
It is the time series for theShowing number of transactions and its revenue and AOV per banner as well as impressions, interactions and most importantly conversion rate from impression to transaction.
AOV is Average order value calculated as division between revenue and number of transactions.
CR is a conversion rate calculated as division between interactions and number of transactions.
CPI is a conversion rate calculated as division between impressions and interactionsnumber of transactions.
Filterable by start and end date, banner name, type and status .
|
|
Unique people reached
|
Number of unique people reached in the selected period.
Filterable by the start date, end date,date and banner.banner Thename, defaulttype and status.
When choosing a time period isweek 30or days.month then trend compares week with the week before that and month with the month before that.
|