Understand the bigger picture of data available in Meiro
|
Learn from this article about: |
The Data tab will help you to understand the bigger picture of your available data: Diagnostic Dashboard, attributes, events, sources, destinations, as well as insights.
Diagnostic Dashboard
Diagnostic Dashboard summarizes information about available customer'scustomer data: whenupdate it was updated, totaltime, number of customers, events, attributesattributes, and more.
- Number of connected sources,
- Customer attributes,
- Customer attributes values,
- Total events,
- Identified customers,
- The average number of events per customer.
The example above shows: 4 available data sources that have collected data for 76,300 customers profiles, 375,400 events, 86 attributes, in total giving 1.4 million attribute values. This givesvalues, an average of 5 events per customer.
| The New Events Over Time(1) and the Number of Identified Customers Over Time (2) |
Check for any dips and spikes in the number of customer events and identified customers. These numbers should broadly align with your customer engagement and acquisition strategy. E.g., expect a hike in numbers following a planned campaign.
In the case |
| Customers updated in the last 7 days (3) |
Summarizes updates for customer entities for the
In the case |
| The number of unique customers identified across x sources(1) |
Shows the number of customers that are identified on 1 through x sources. The higher the number of identified customers in the higher across-data sources, the better the performance of the customer profiling
The chart above shows that the highest number of customers (44.3 k) is identified only in 1 source, while 31.2k customers across 2 sources., 1.4k (3 sources), 2.5k (4 sources), 236 (5 sources), 796 (6 sources), 42 (7 sources). |
| The number of customers identified per source(2) |
Shows the data sources that hold the highest/lowest amount of customers.
The chart above websites and Marketo collect the highest |
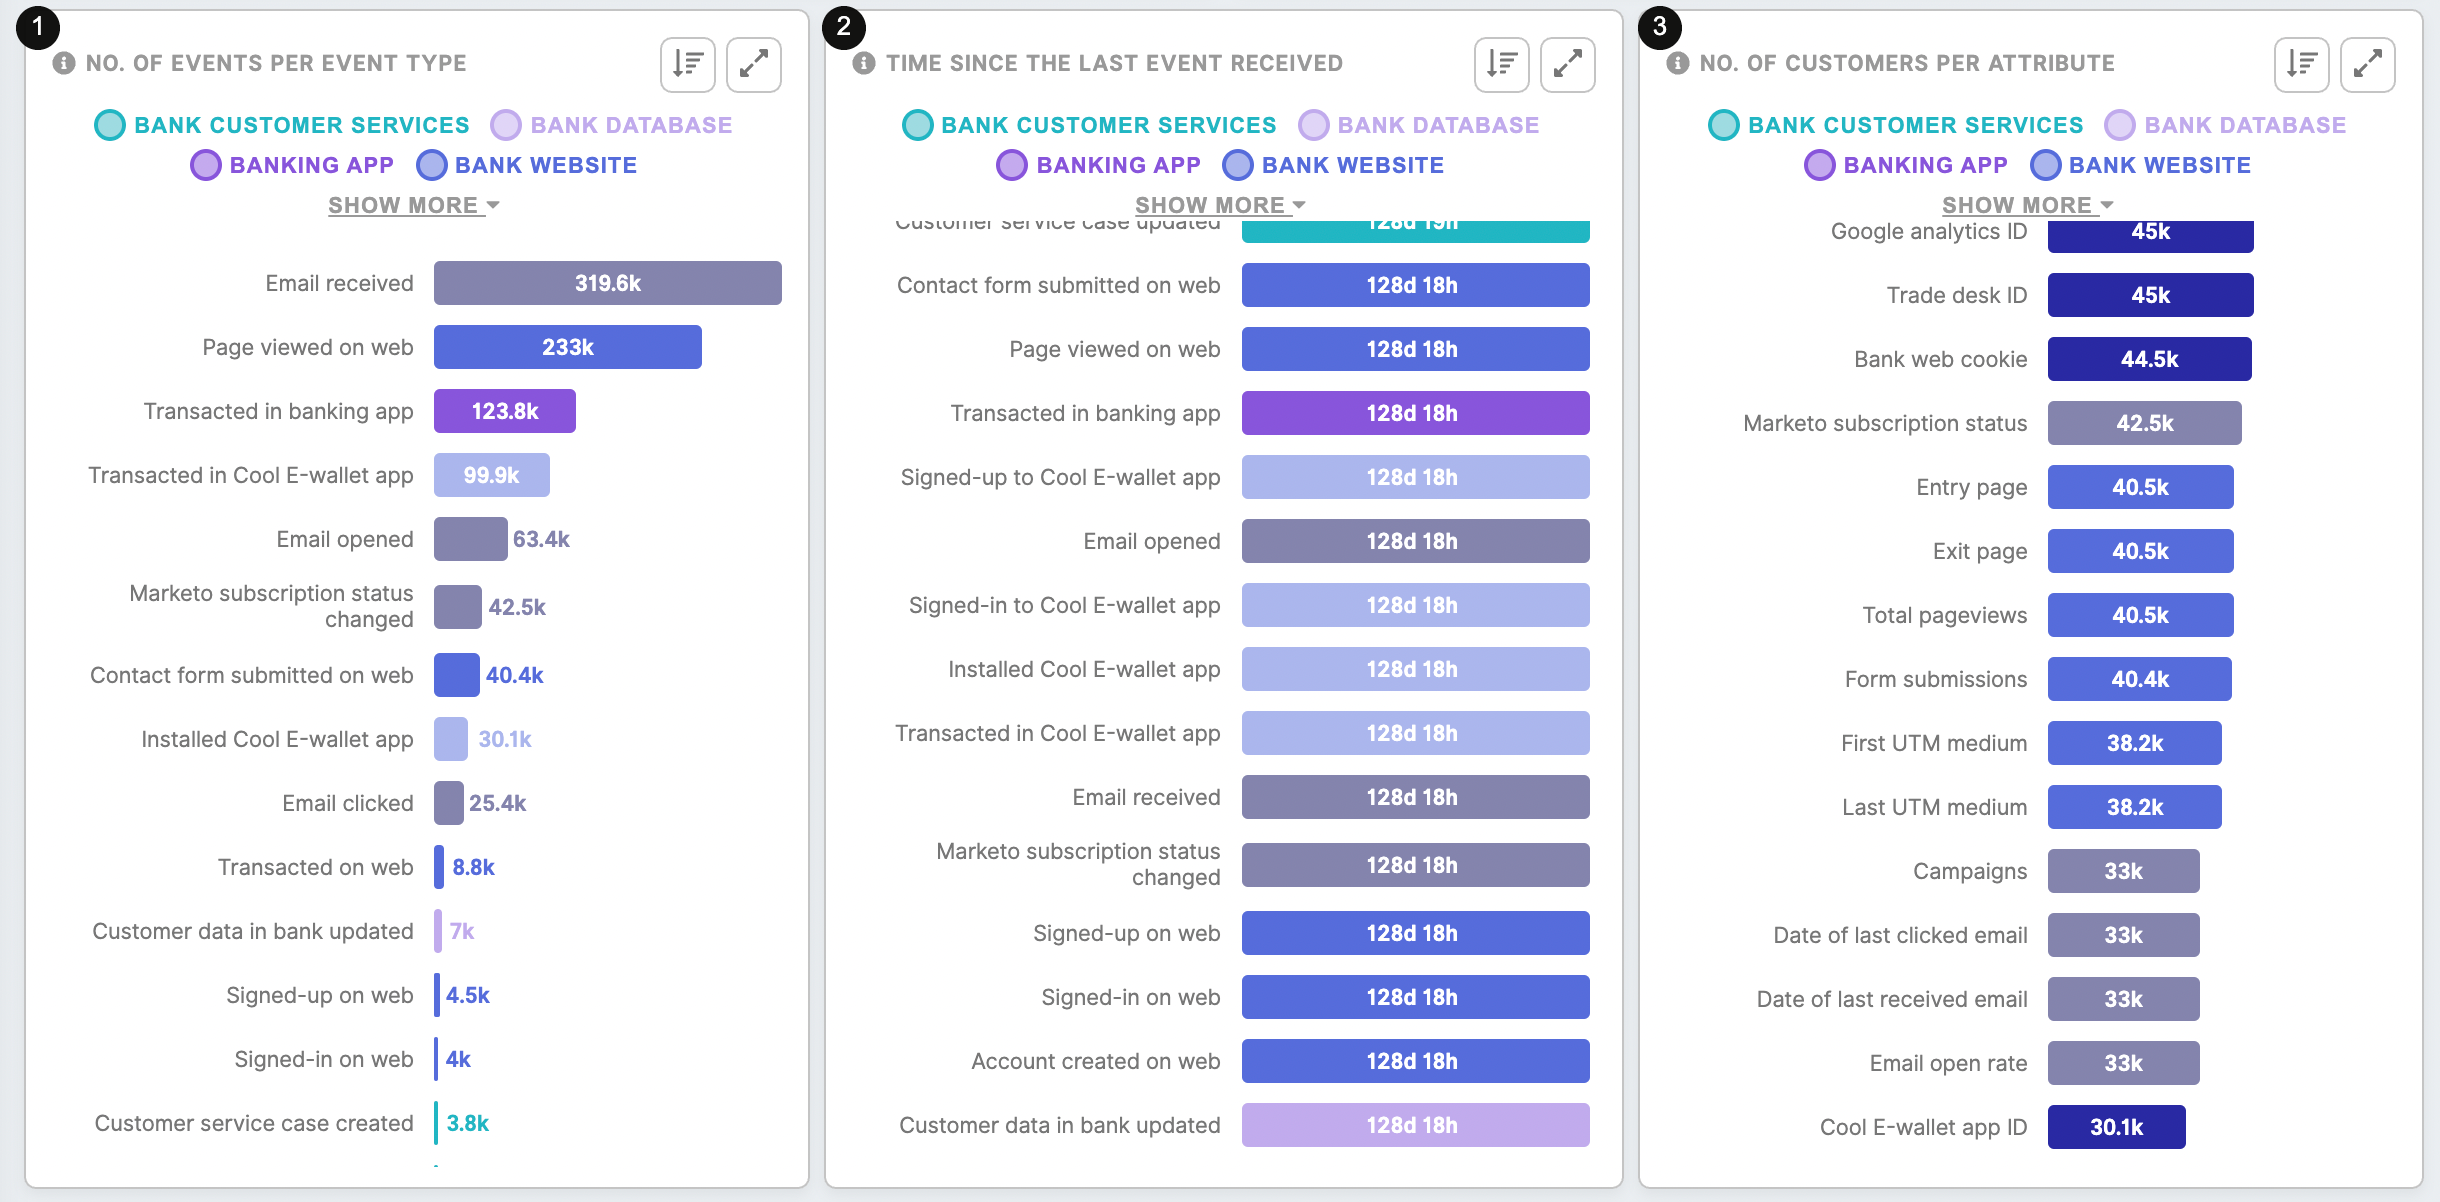
| The number of events per event type(1) |
Shows how many actions customers performed, the type of actions
|
| The time since the last event received(2) |
Shows how up to date events are.
The example above shows that the oldest event is the "Contact form submitted on the web", 128 days, 18 hours. This time is |
| The number of customers per attribute(3) |
In the example above, we can see that, for example, Google Analytics ID, Trade Desk ID are the most populated for the customers (45 000) |
Insights tab
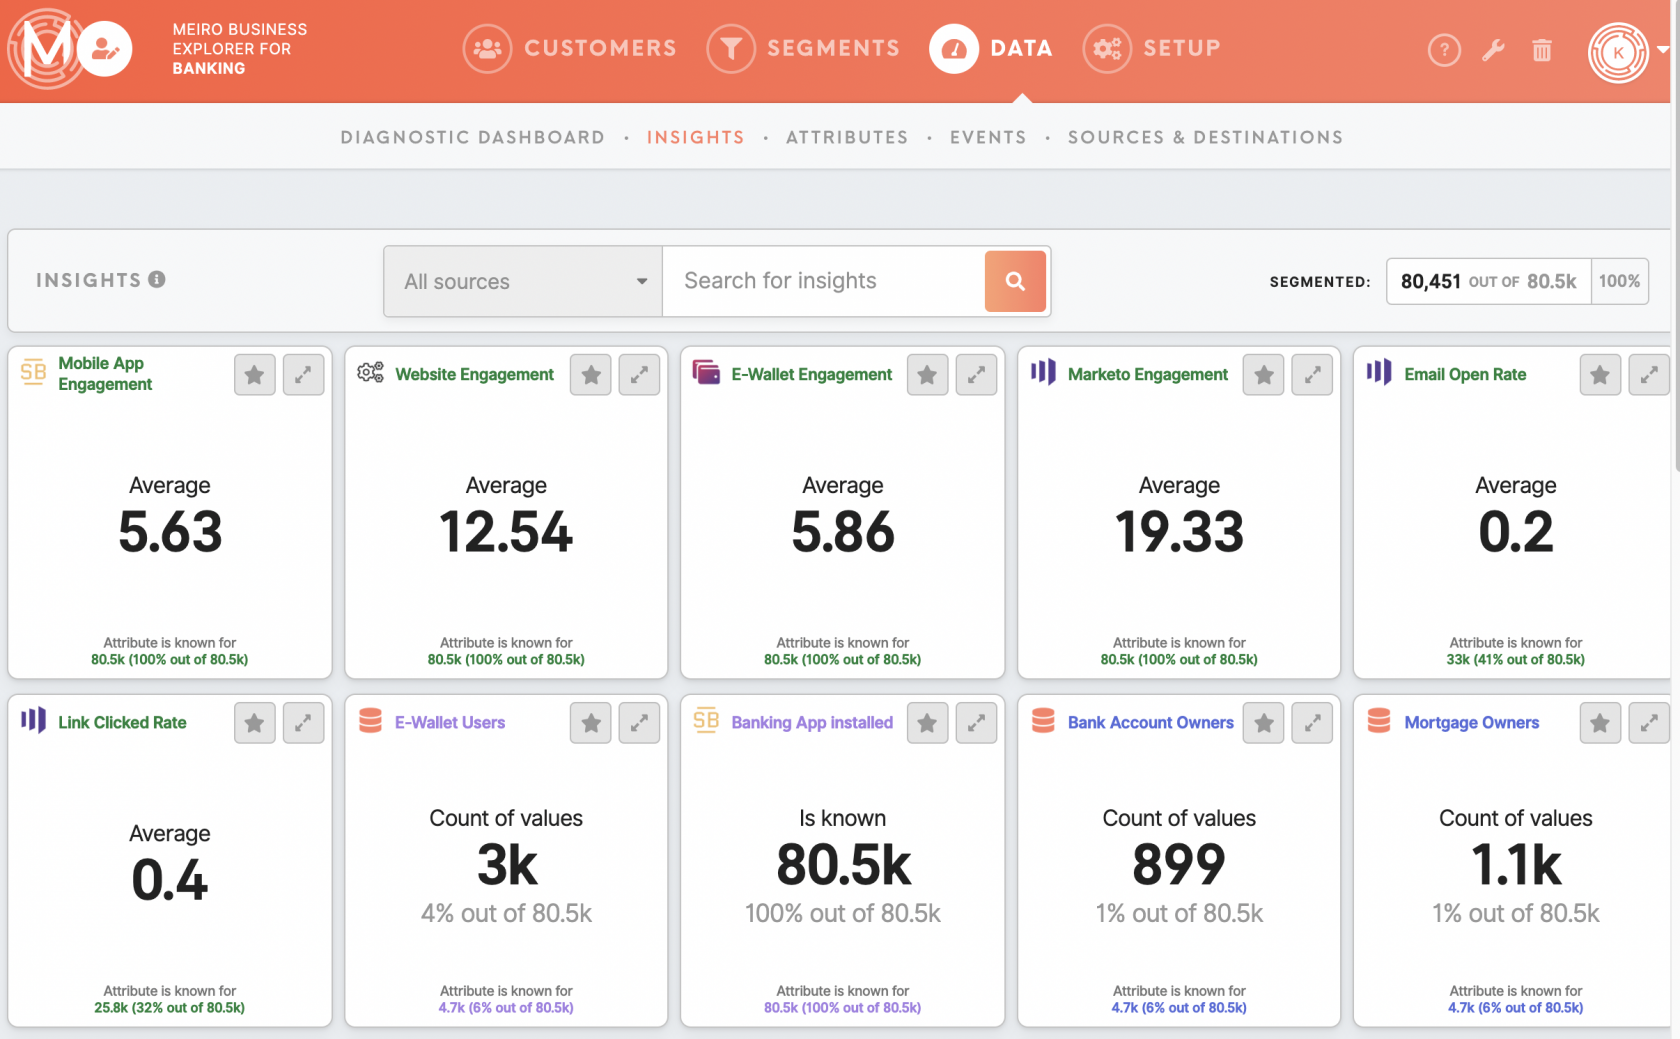
Insights are a set of tiles with various analytics for segmented groups. Insights are built based on attributes and conditions (
Learn more: about insight from this article.
Attributes, events, sources & destinations
Check out in other tabs what attributes, events, sources and destinations are available.
Attributes: See all attributes known for customers' database. Based on attributes and its values segment audiences in the Segments tab.
Events: Events are known activities of customers. Events are used in each customer profile to describe customer activity (events).
Sources: from where customer data is known from.
Destinations: where segmented data can be exported to activate it further.


