Tab: Data
|
Learn from this article about: |
Diagnostic Dashboard
Diagnostic Dashboard displays infromation about your available customers' data.
| Data updated | How long ago the dashboard has been updated |
| Connected sources | Number of all the data sources connected. All connected sources are listed in the Data tab/ Sources& Destinations tab |
| Customer attributes | The total number of customers all attributes. All attributes are listed in the Data tab/ Attributes tab. |
| Customer attributes values | The total number of values for attributes for all customers. |
| Total events | The total number of events for all customers. All listed events are available in the Data tab/ Events tab. |
| The number of customers | The total number of customers. Browsing through all customer profiles is possible in the Customers tab. |
| The average number of events per customer | The average number of events per customer helps to see the average density of information we have available for a customer. |
License usage will be visible only to users that are granted access in their user role.
|
Monthly processed events (last 30 days) |
Total events processed in the last 30 days. |
|
Total events stored (as of now) |
Total events in storage, including hidden events. |
|
Total number of unified profiles |
Total number of unified profiles after profile stitching. |
| New events over time(1) |
Stacked chart with the number of events collected. Watch out for extreme dips or spikes as they might indicate irregularity in the data. Resolution for charts is auto calculated in: days - if the events activity <= 60 days weeks - if the events activity <= 60 * 7 days months - otherwise (events activity > 60 * 7 days) |
| Number of identified customers over time (2) |
The number of identified customers across the time. Watch out for extreme dips or spikes as they might indicate irregularity in the data and/or customers' identification process. Resolution for charts is auto calculated in: days - if the customers identified <= 60 days weeks - if the customers identified <= 60 * 7 days months - otherwise (events activity > 60 * 7 days) |
| Customers updated in the last 7 days (3) | This chart shows if customers' attributes are kept up to date. Immediate updates happen each time a new event arrives. Also when a customer entity merges with another customer entity. Depending on the instance full entities refresh happen from 1- 7 days. |
| The number of unique customers identified across x sources(1) | The number of customers identified through x sources. The maximum of x is the total number of data sources. The higher the number of identified customers across data sources, the better the performance of the customer profiling process, and the better the quality of the customer profile output. |
| The number of customers identified per source(2) | This profile shows the number of identified customers per data source. |
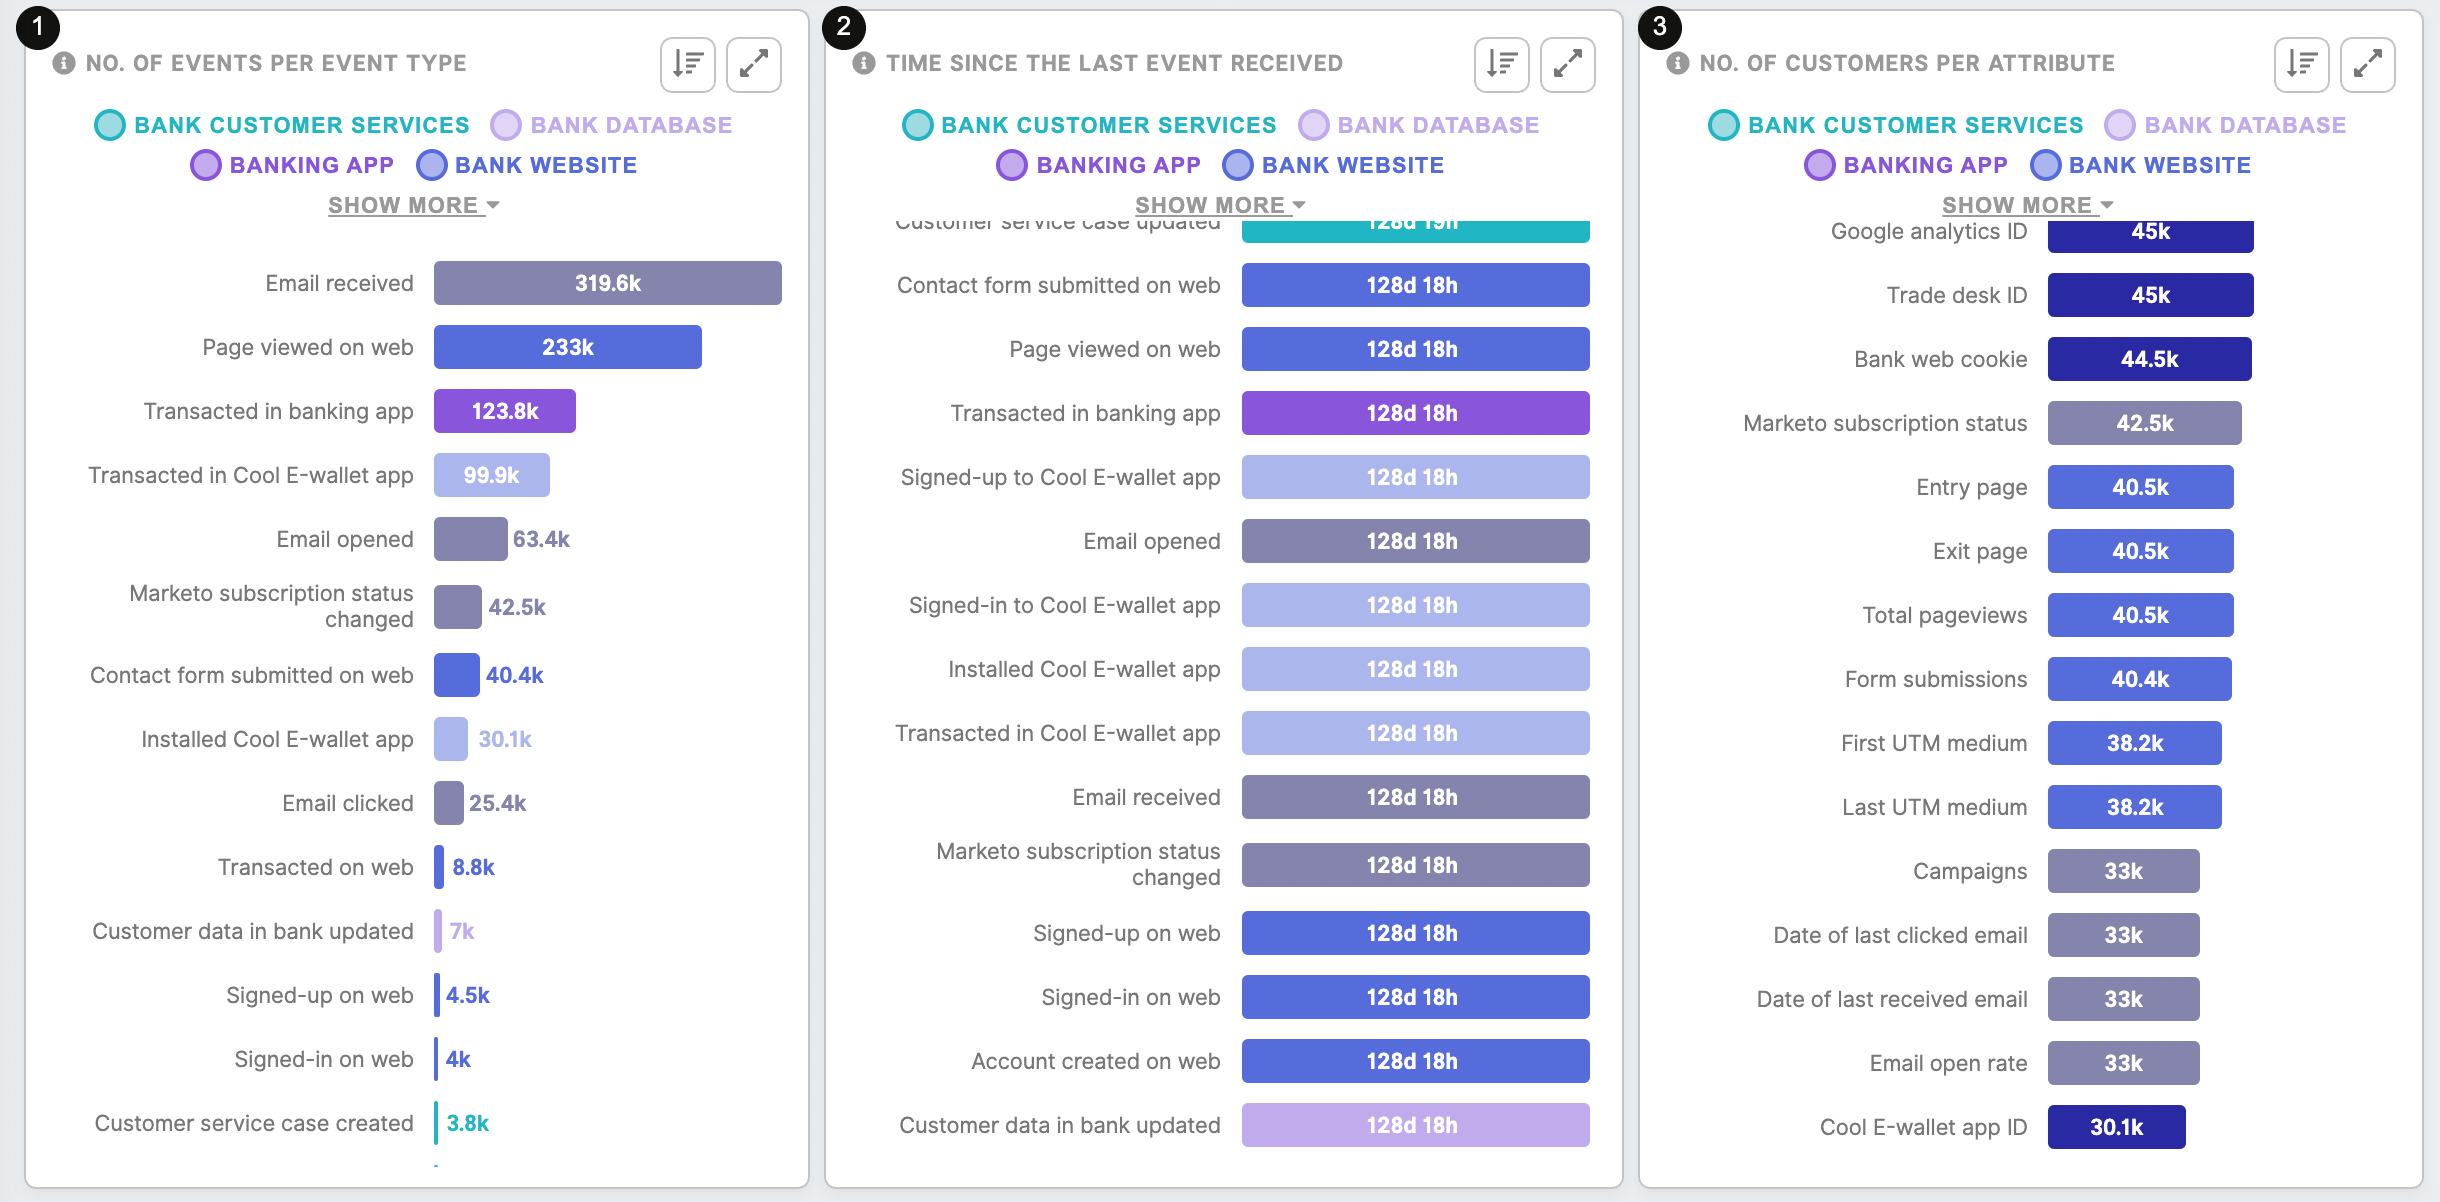
| The number of events per event type(1) | Customer engagement across different types of events captured in your project. Check out which channels and/or activities your customer engages with the most. |
| The number of customers per attribute(2) | The number of identified customers by each attribute in your projects. |
| The time since the last event received(3) | The elapsed time since the last event of each event type. Events are usually collected daily. If the event data reception time is exceeded, it may indicate that your data is not collected frequently enough. In some cases, this may indicate that there are no new events available (for example there have not been transactions for that particular day made). |
Insights tab
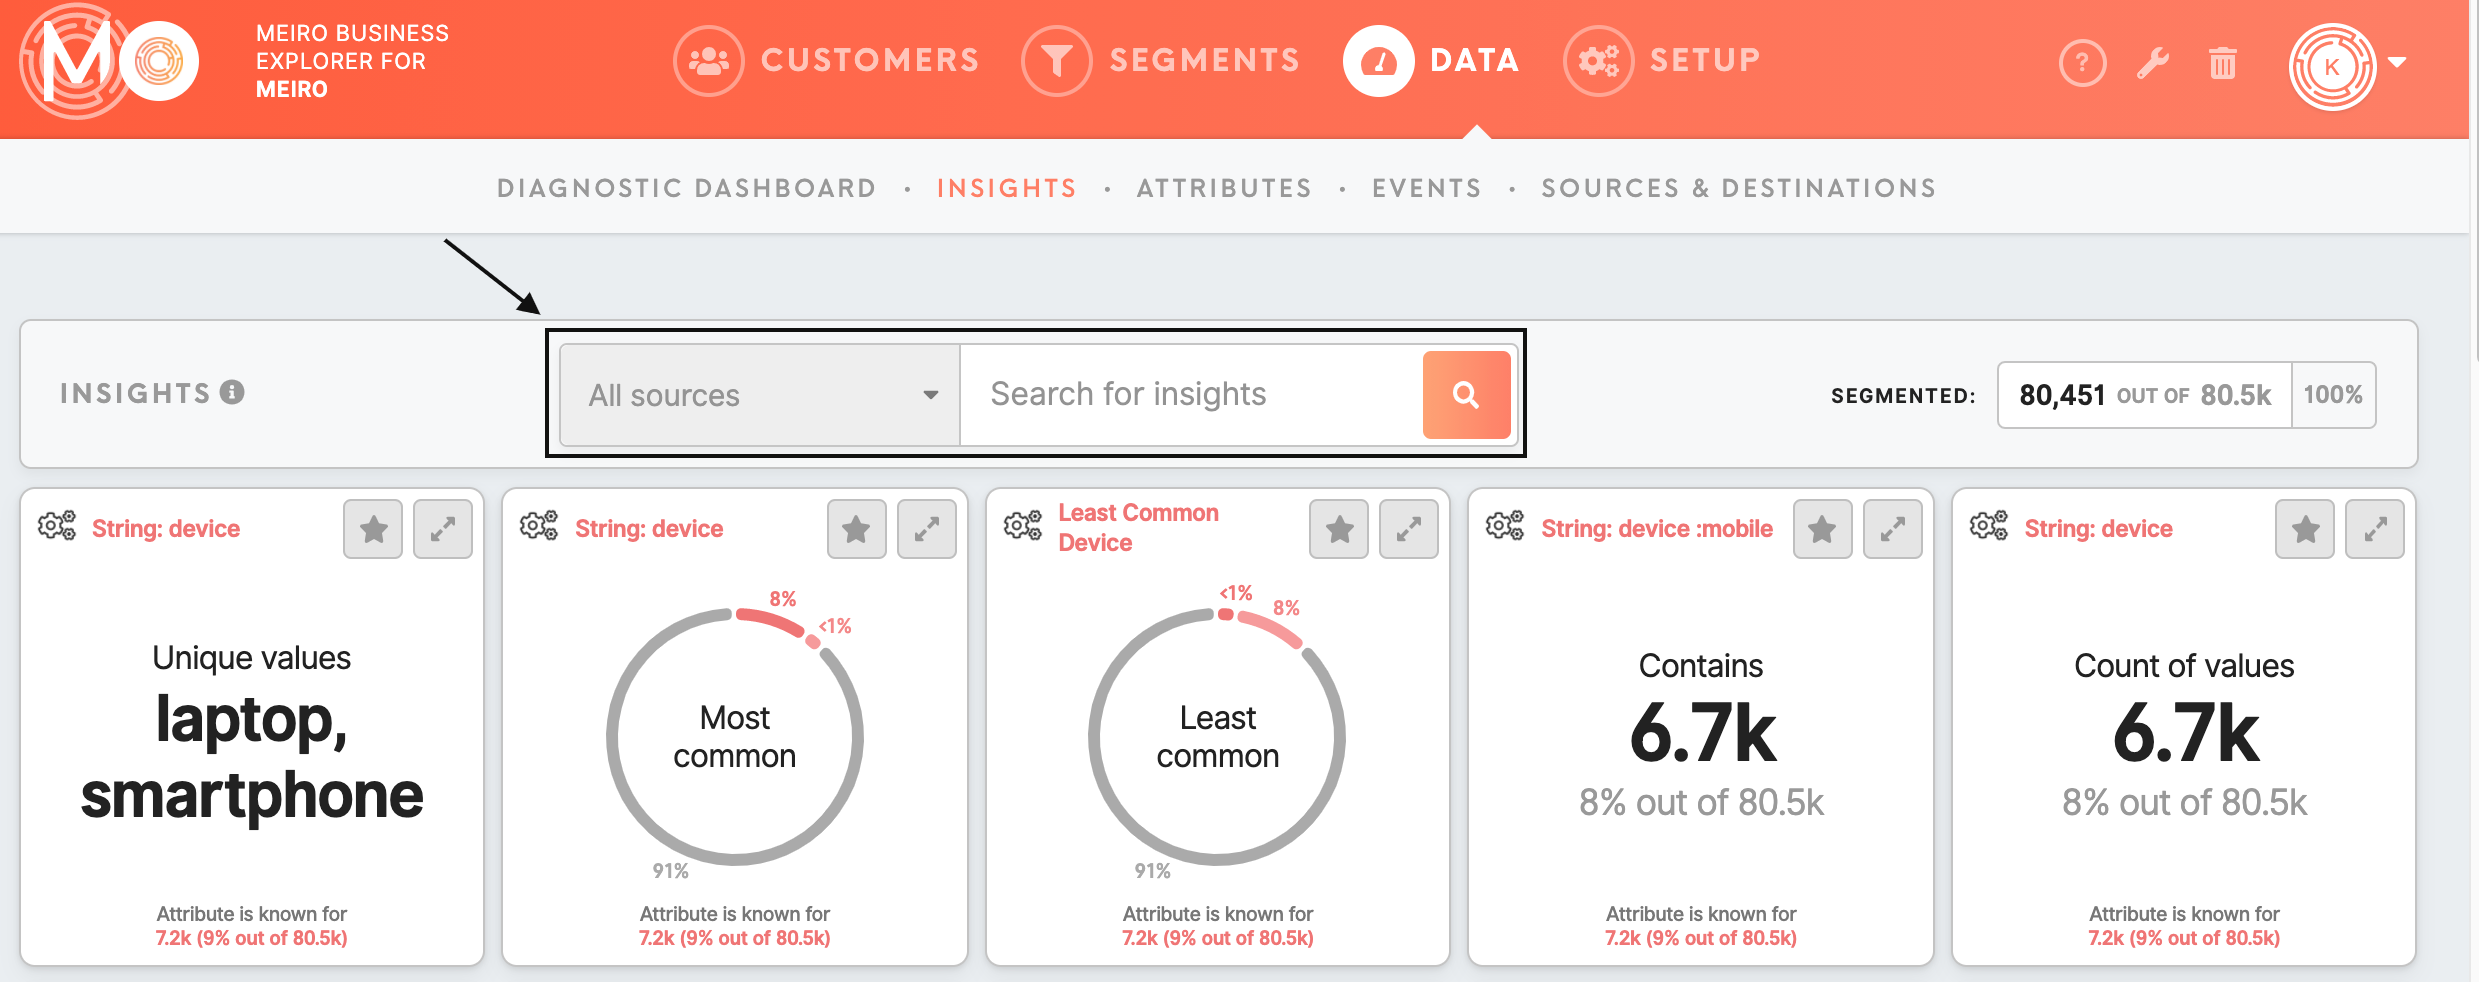
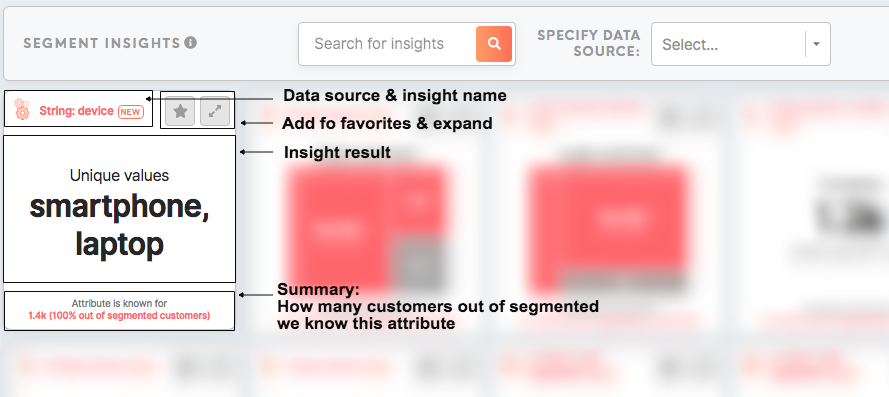
Insights for all the customer databases are in the Data tab/ Insights tab. Insights for each segment are in the Segment Detail/ Insights tab.
Search through insights:
- By name
- By data source of the attribute, the insight is calculated from
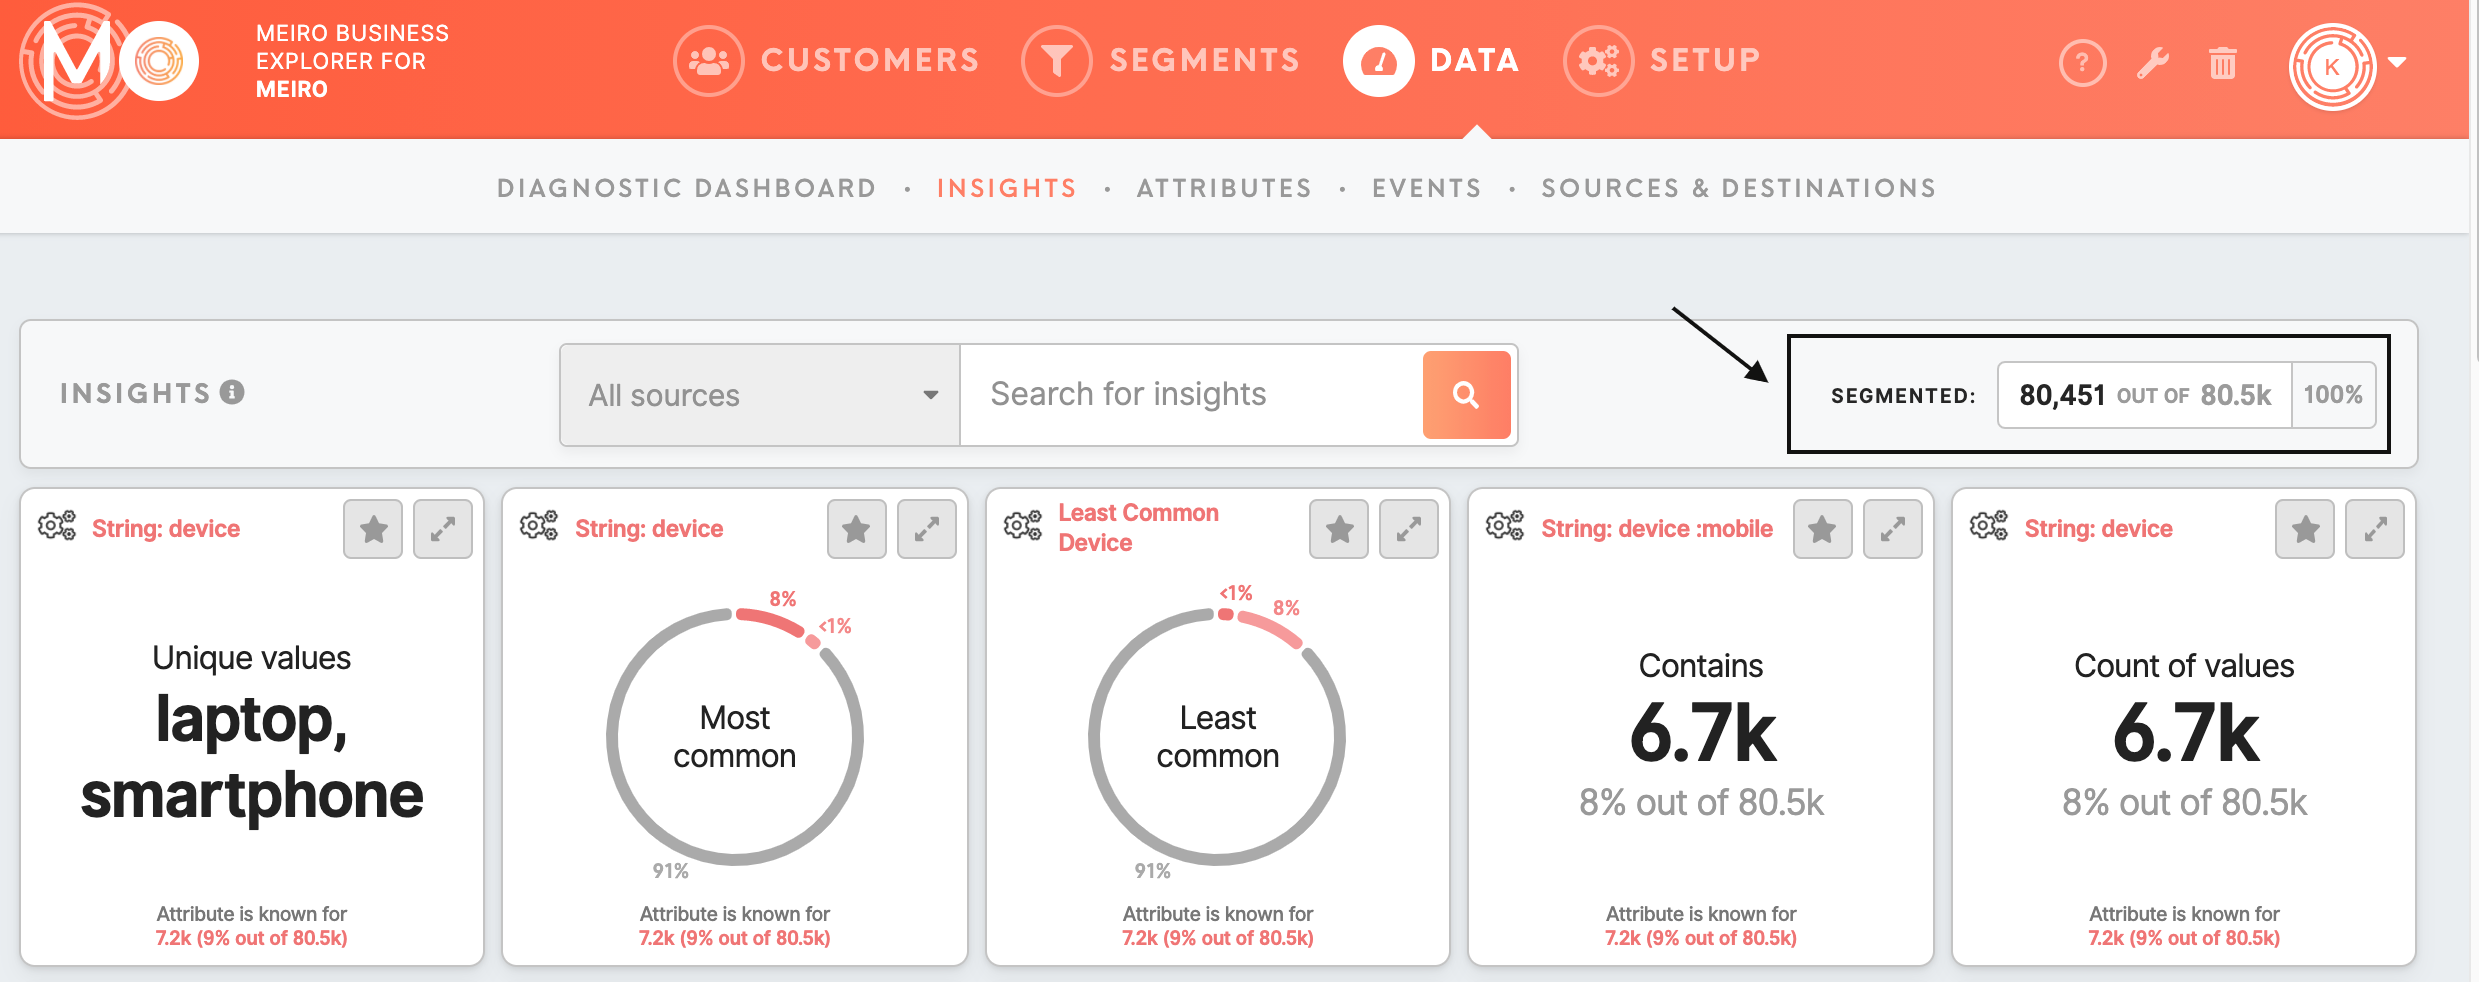
See for how many customers your insights are calculated for:
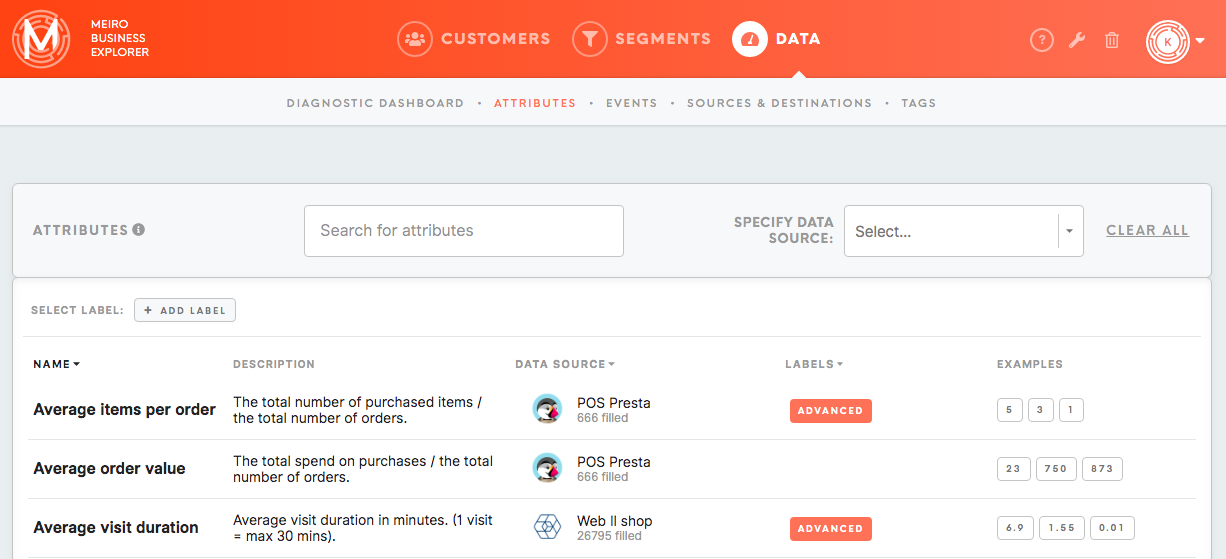
Attributes tab
The Attributes tab shows:
- Name of attributes,
- Descriptions of all available attributes,
- Their data source(s),
- Labels assigned to attributes.
- Examples of a particular attribute.
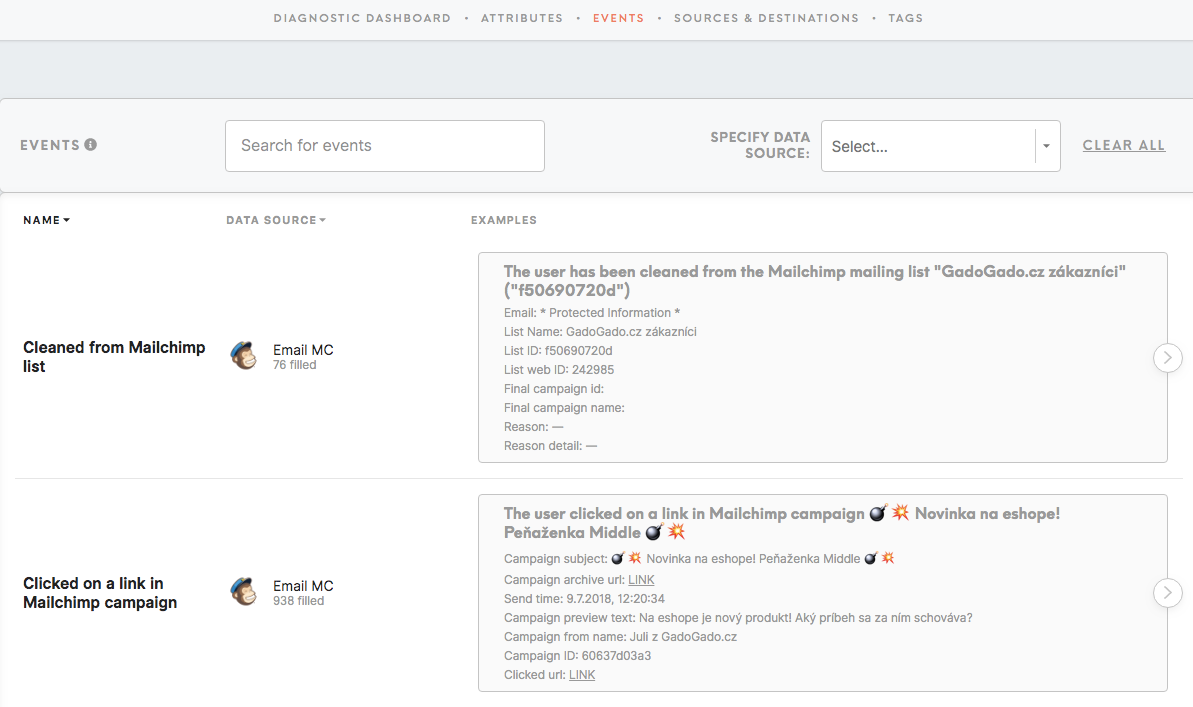
Events tab
The Events tab shows:
- Name of events,
- Events data sources,
- Examples of events.
Sources & Destinations tab
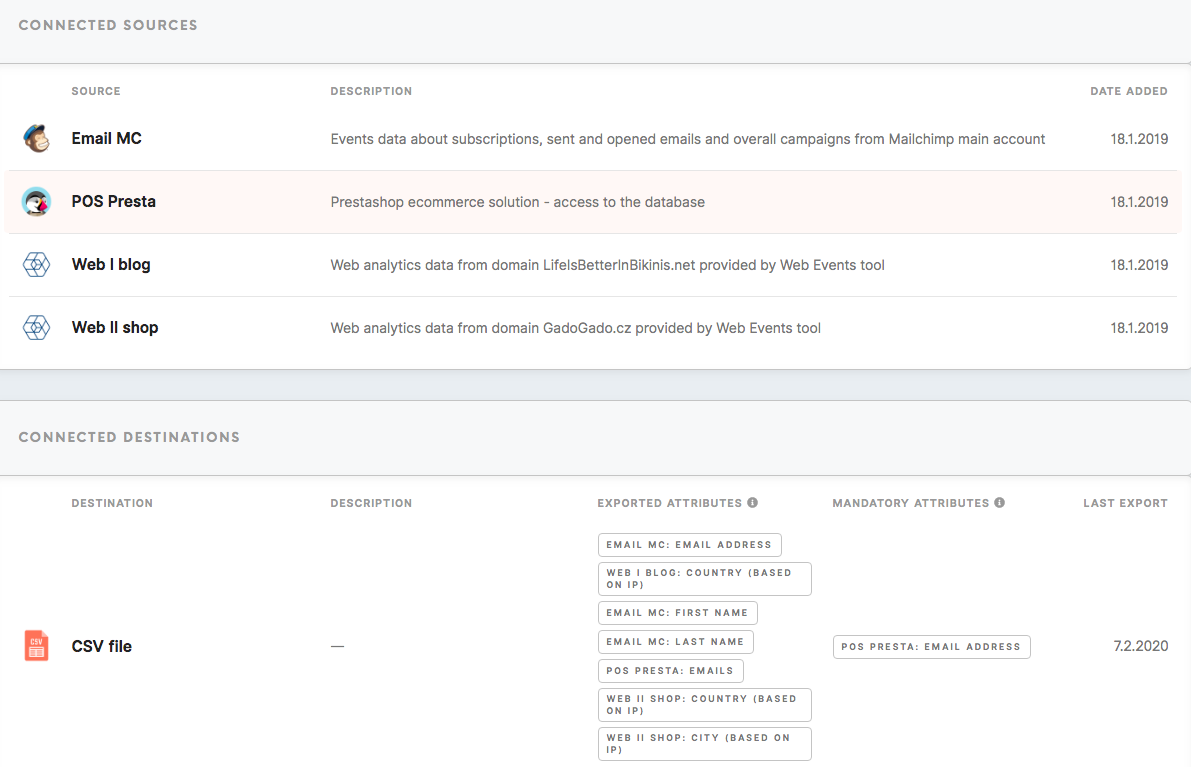
The Sources & Destinations tab lists connected data sources, as well as possible segment export destinations.
Connected Sources
In the Connected Sources section see:
- The name of the source and description,
-
The date added.
Connected Destinations
In the Connected Destinations section see:
- Destinations names and descriptions,
- Exported attributes (attributes that will be exported to your chosen destination),
- Mandatory attributes (attributes that must be present in order to export to the destination)
- Last export date.
Learn more: Understand the bigger picture of your data


