Sources setup
Entities setup is usually done by theCDP Meirotechnical team.consultant.
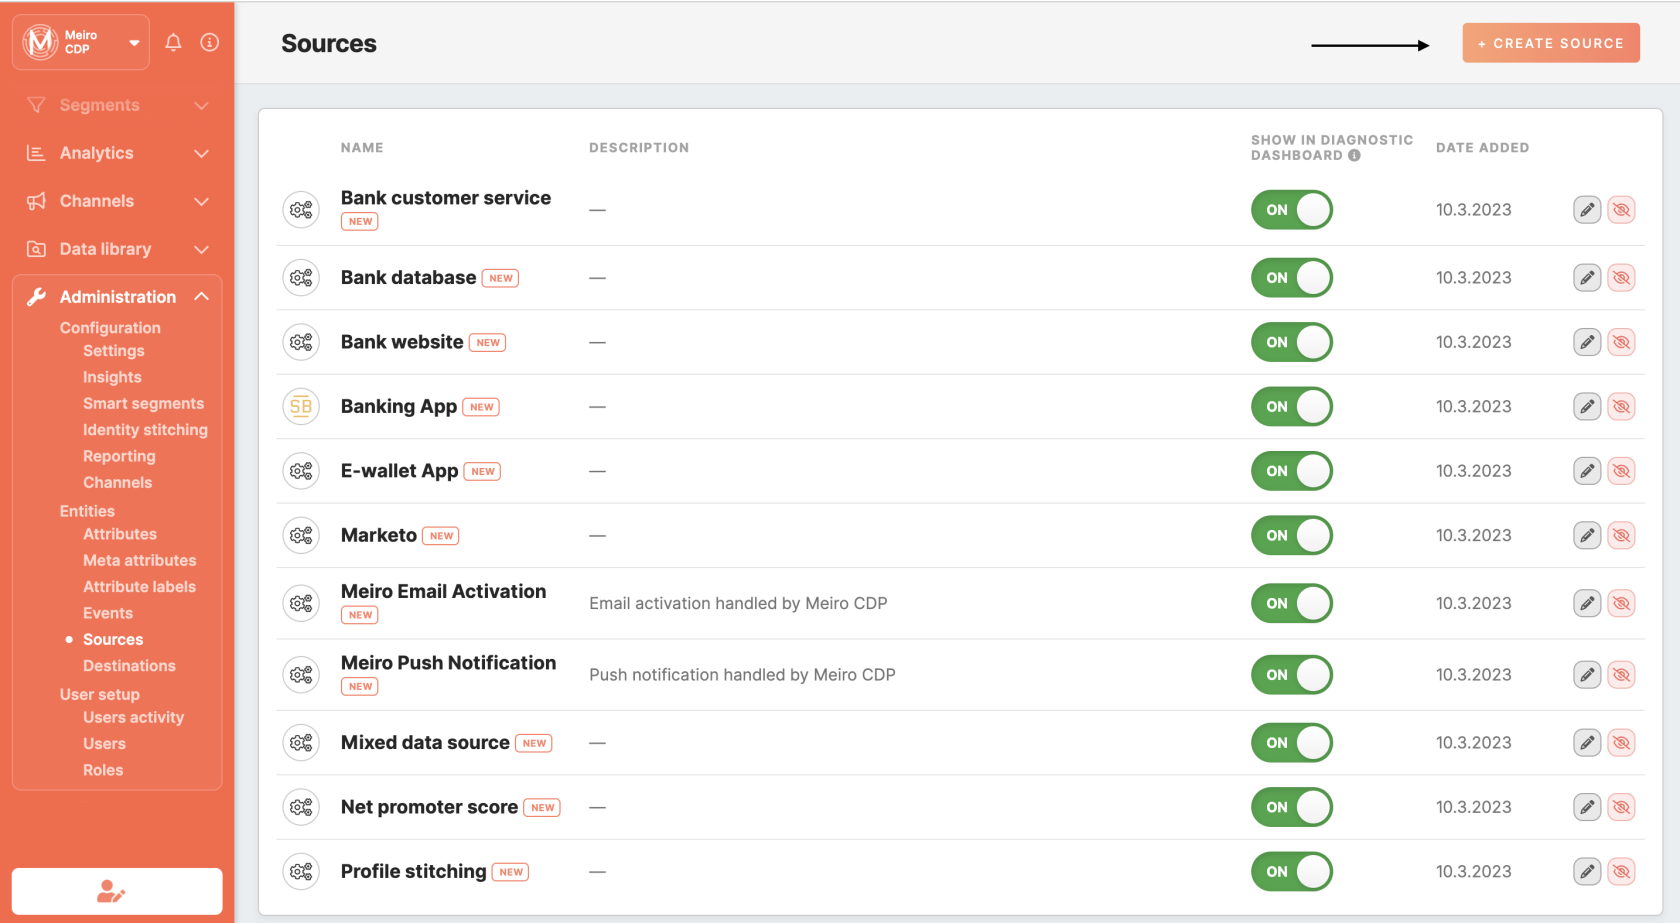
In the Administration/Entities/Sources tab, it is possible to: create, edit, hide/ show data sources. A full list of sources will be visible to users in the Data library/ Sources tab.
|
Learn from this article: Manage the display of sources within the Diagnostic Dashboard in the Analytics tab |
1. Create a source
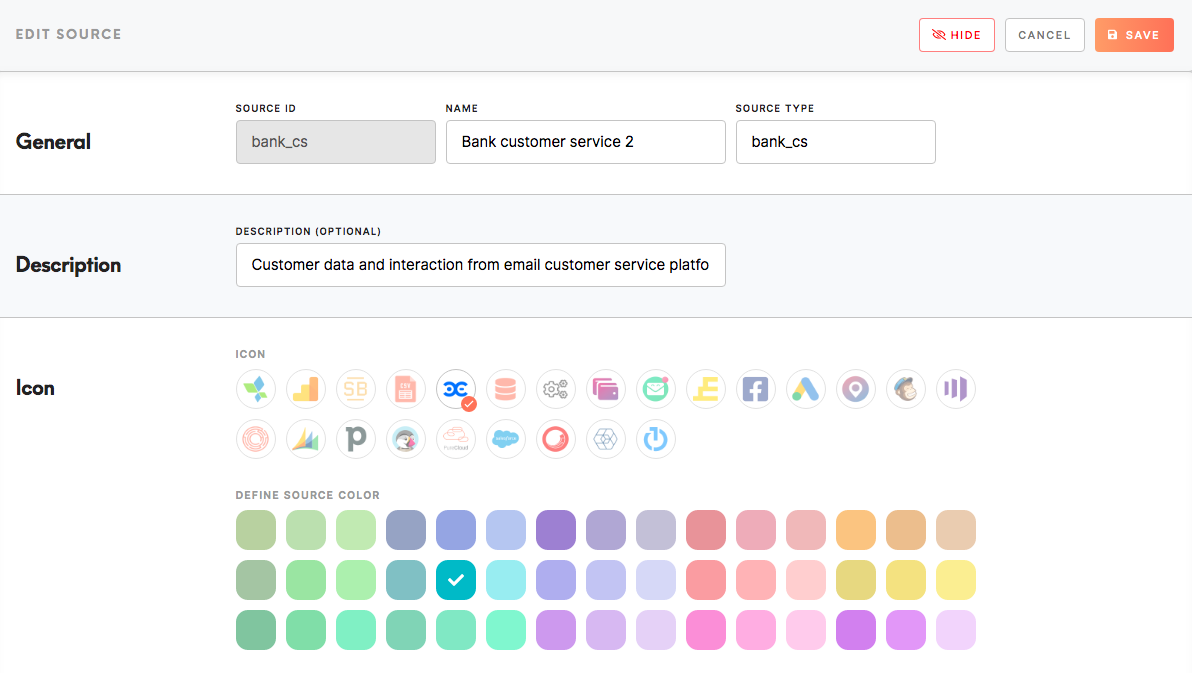
To add a data source, please click on the Create button and fill out the form that will be displayed.

|
Source ID (unique, not editable later) |
Source ID is a unique id assigned to the source that can be referred to through Meiro products. Warning: The source ID will not be possible to edit later on, therefore, please pay attention to what ID is inserted. It would need to be deleted and created again. |
|
Name |
Name your data source. The name will be visible across Meiro Business Explorer. It is possible to edit the name later on. |
|
Source type |
Select the source type. It is possible to edit the source type later on. |
|
Description (optional) |
It is optional to add a description. If defined will be displayed in the Data library/ Sources tab. |
|
Icon |
Select the icon under which the data source will appear. It is also possible to select neutral icons, this feature is useful for mixed data sources or profile stitching data sources. Define source color which will represent the source in the Diagnostic Dashboard or in insights (if set with no other color). |
Remember: Changes will be saved after clicking on the Save button.
Remember: Newly created sources will appear with the New badge that will stay for the next 7 days.
2. Edit/show-hide a source
At any time, it is possible to edit data sources. If needed, it is possible to hide a source from the Meiro interface, then hidden data source and attributes/ events connected to the source will not be displayed in the Meiro interface.
Warning: The only field that is not editable is Source ID. If filled wrong, it is recommended to hide the incorrect source and create a new one.

3. Diagnostic Dashboard
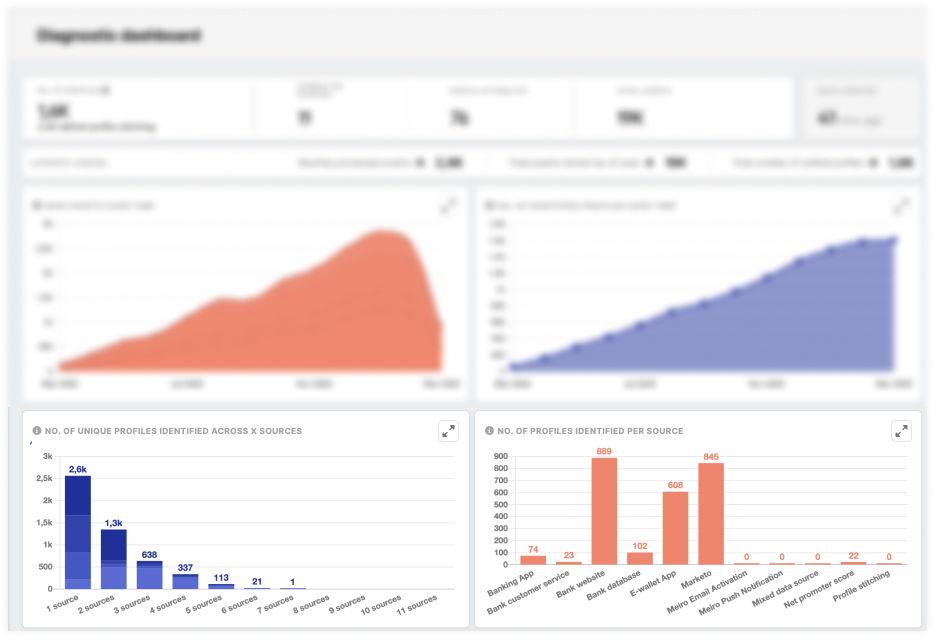
Where: In the Analytics tab, it is possible to set the visibility of data sources in the Diagnostic Dashboard ("Number of Unique Profiles Identified Across x Sources" and "Number of Profile Identified Per Source", No of connected sources).
Use case: This feature is useful with data sources like "Profile Stitching", and "Mixed Data Sources" that are important to distinguish for analysts (therefore visible under the Data Library/ Sources tab) but not always important for other users to view on the Diagnostic Dashboard as a separate data source.
How: To hide the data source from the Diagnostic Dashboard, simply use the toggle.
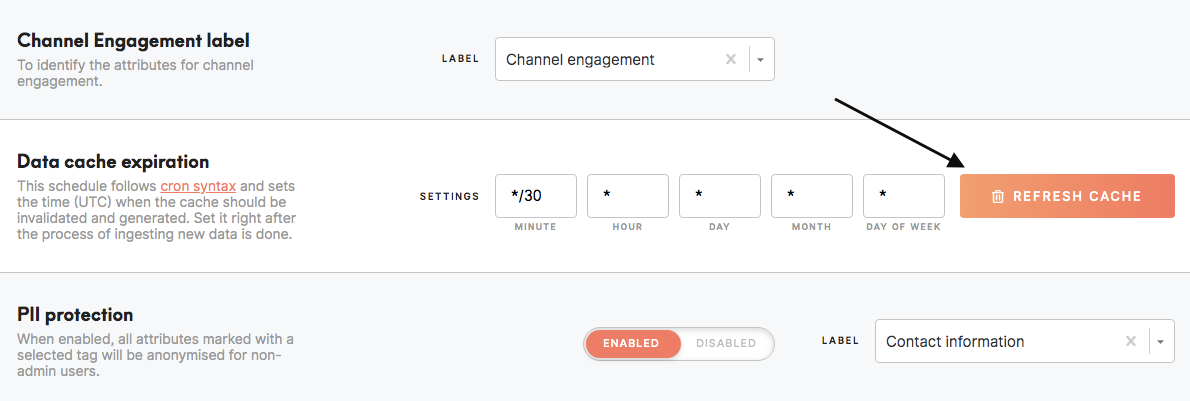
Remember: Show/ hide data source with the toggle "Show in Diagnostic Dashboard". Changes will be seen after the closest cache refresh. In order to see the changes as soon as possible, an administrator should refresh the cache manually in the Administration tab/ Settings tab.


