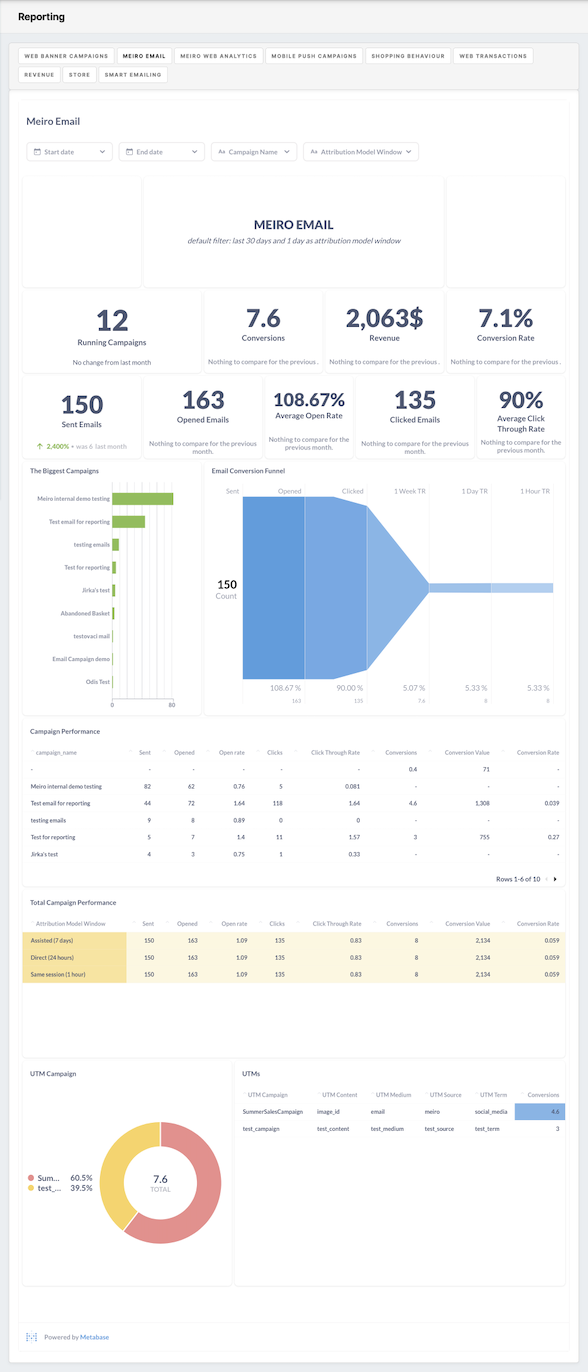
Reporting dashboard example: Meiro Emails
|
Running campaigns |
It shows the number of running campaigns. Filterable by start date and end date. The default period is 30 days. Choose a week or month and compare: set a week with the previous one or a month with the previous one. |
|
Conversions |
It shows the number of conversions counts achieved through the campaign. Filterable by start and end date, campaign name, and conversion window. |
|
Revenue |
Displays the total revenue generated from the campaigns. |
|
CR (Conversion Rate) |
Calculates the average conversion rate within a specified attribution window. The conversion rate is determined by dividing the number of conversions by the number of email clicks. You can apply filters based on the start date, end date, campaign name, and conversion window. |
|
Sent Emails |
It shows the number of emails sent. Filterable by start date and end date. The default period is 30 days. Choose a week or month and compare: set a week with the previous one or a month with the previous one. |
|
Opened Emails |
It shows the number of opened emails. Filterable by start date and end date. The default period is 30 days. Choose a week or month and compare: set a week with the previous one or a month with the previous one. |
|
Average Open rate |
Represents the average percentage of opened emails. It is calculated by dividing the number of clicked emails by the number of opened emails. You can filter the results by start date and end date. When comparing time periods (week or month), the trend compares the current week or month with the previous one. |
|
Clicked Emails |
It shows the number of email clicks. Filterable by start date and end date. Choose a week or month and compare: set a week with the previous one or a month with the previous one. |
|
Average Click through rate |
Represents the average percentage of clicked emails. It is calculated by dividing the number of clicked emails by the number of impressions. You can apply filters based on the start date and end date. When comparing time periods (week or month), the trend compares the current week or month with the previous one. |
|
The biggest campaign |
Displays campaigns with the highest number of sent emails. You can filter the results by start date and end date. |
|
Email conversion funnel |
Displays the funnel for ad performance, starting from the email sent to the transaction. You can filter the results by start date, end date, and campaign name. The default period is 30 days. |
|
Campaign performance |
Provides a comprehensive overview of key metrics for campaigns within the specified Attribution Model Window:
|
|
Total Campaign performance |
A comprehensive table that provides various key performance metrics for campaigns. It includes the following metrics:
You can filter the results by start date, end date, campaign name, and conversion window. |

