Reporting dashboard example: KPI overview
|
Examples of charts:
|
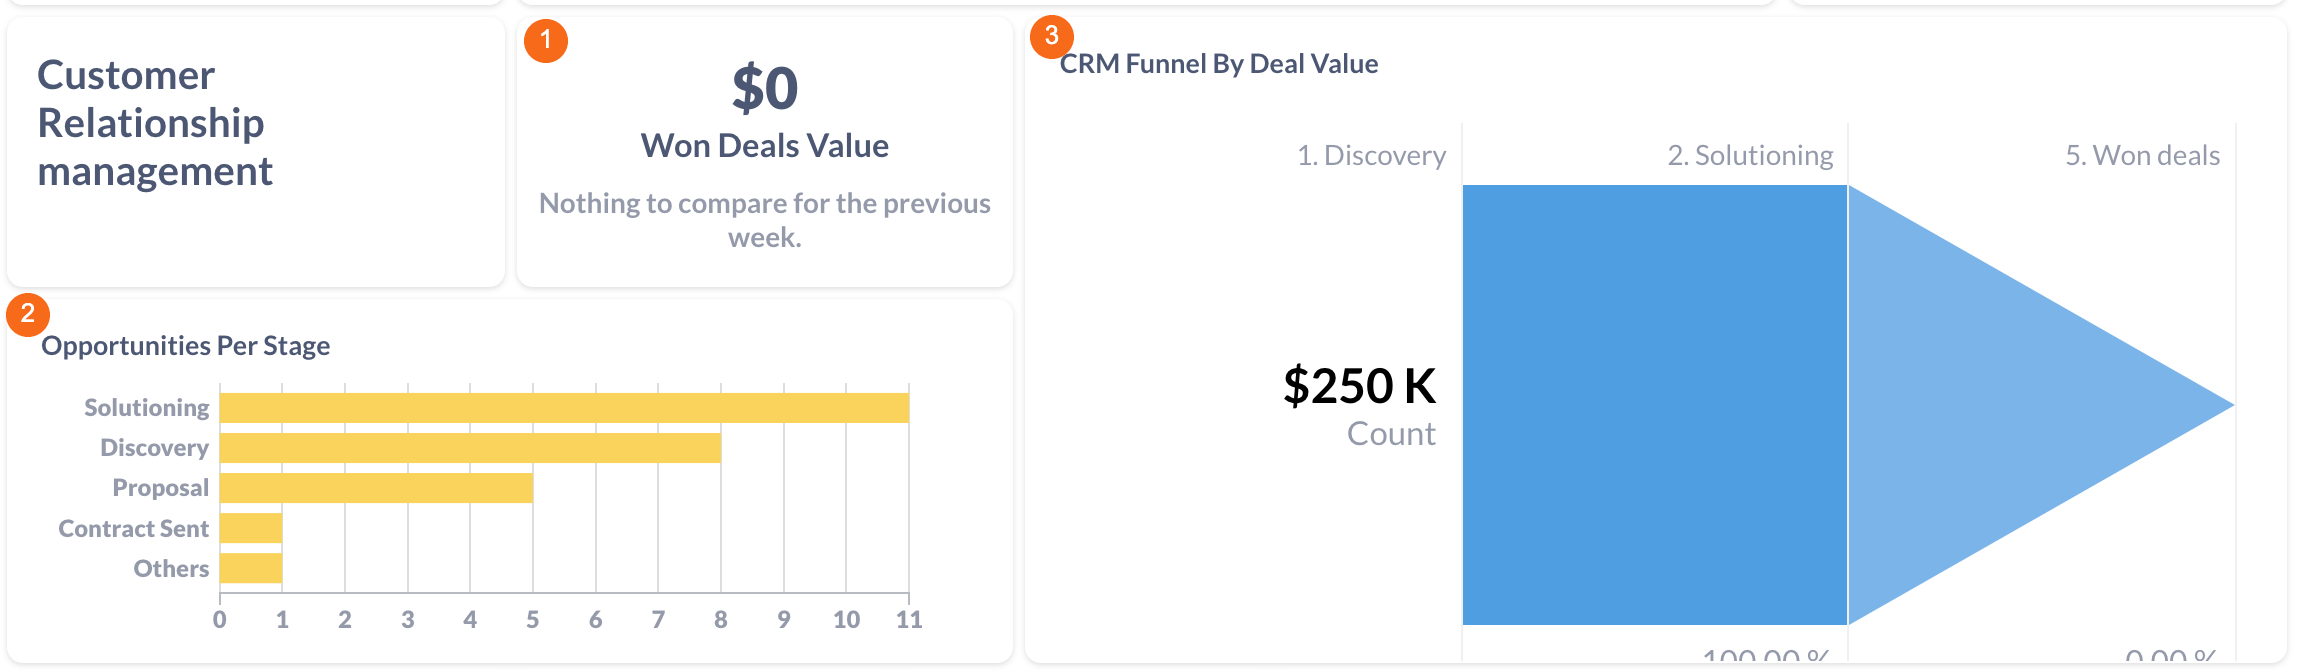
Customer Relationship Management
|
1. Won deals value |
Filterable by start date and end
|
|
2. Opportunities per stage |
Filterable by start date and end |
|
3. CRM funnel by deal value |
Filterable by start date and end |
Website

|
1. |
Filterable by start date and end
|
|
2. Users |
Filterable by start date and end
|
|
3. Top 5 bounce rate traffics |
Filterable by start date and end |
|
4. |
Filterable by start date and end |
|
5. Sessions per traffic source |
Filterable by start date and end |
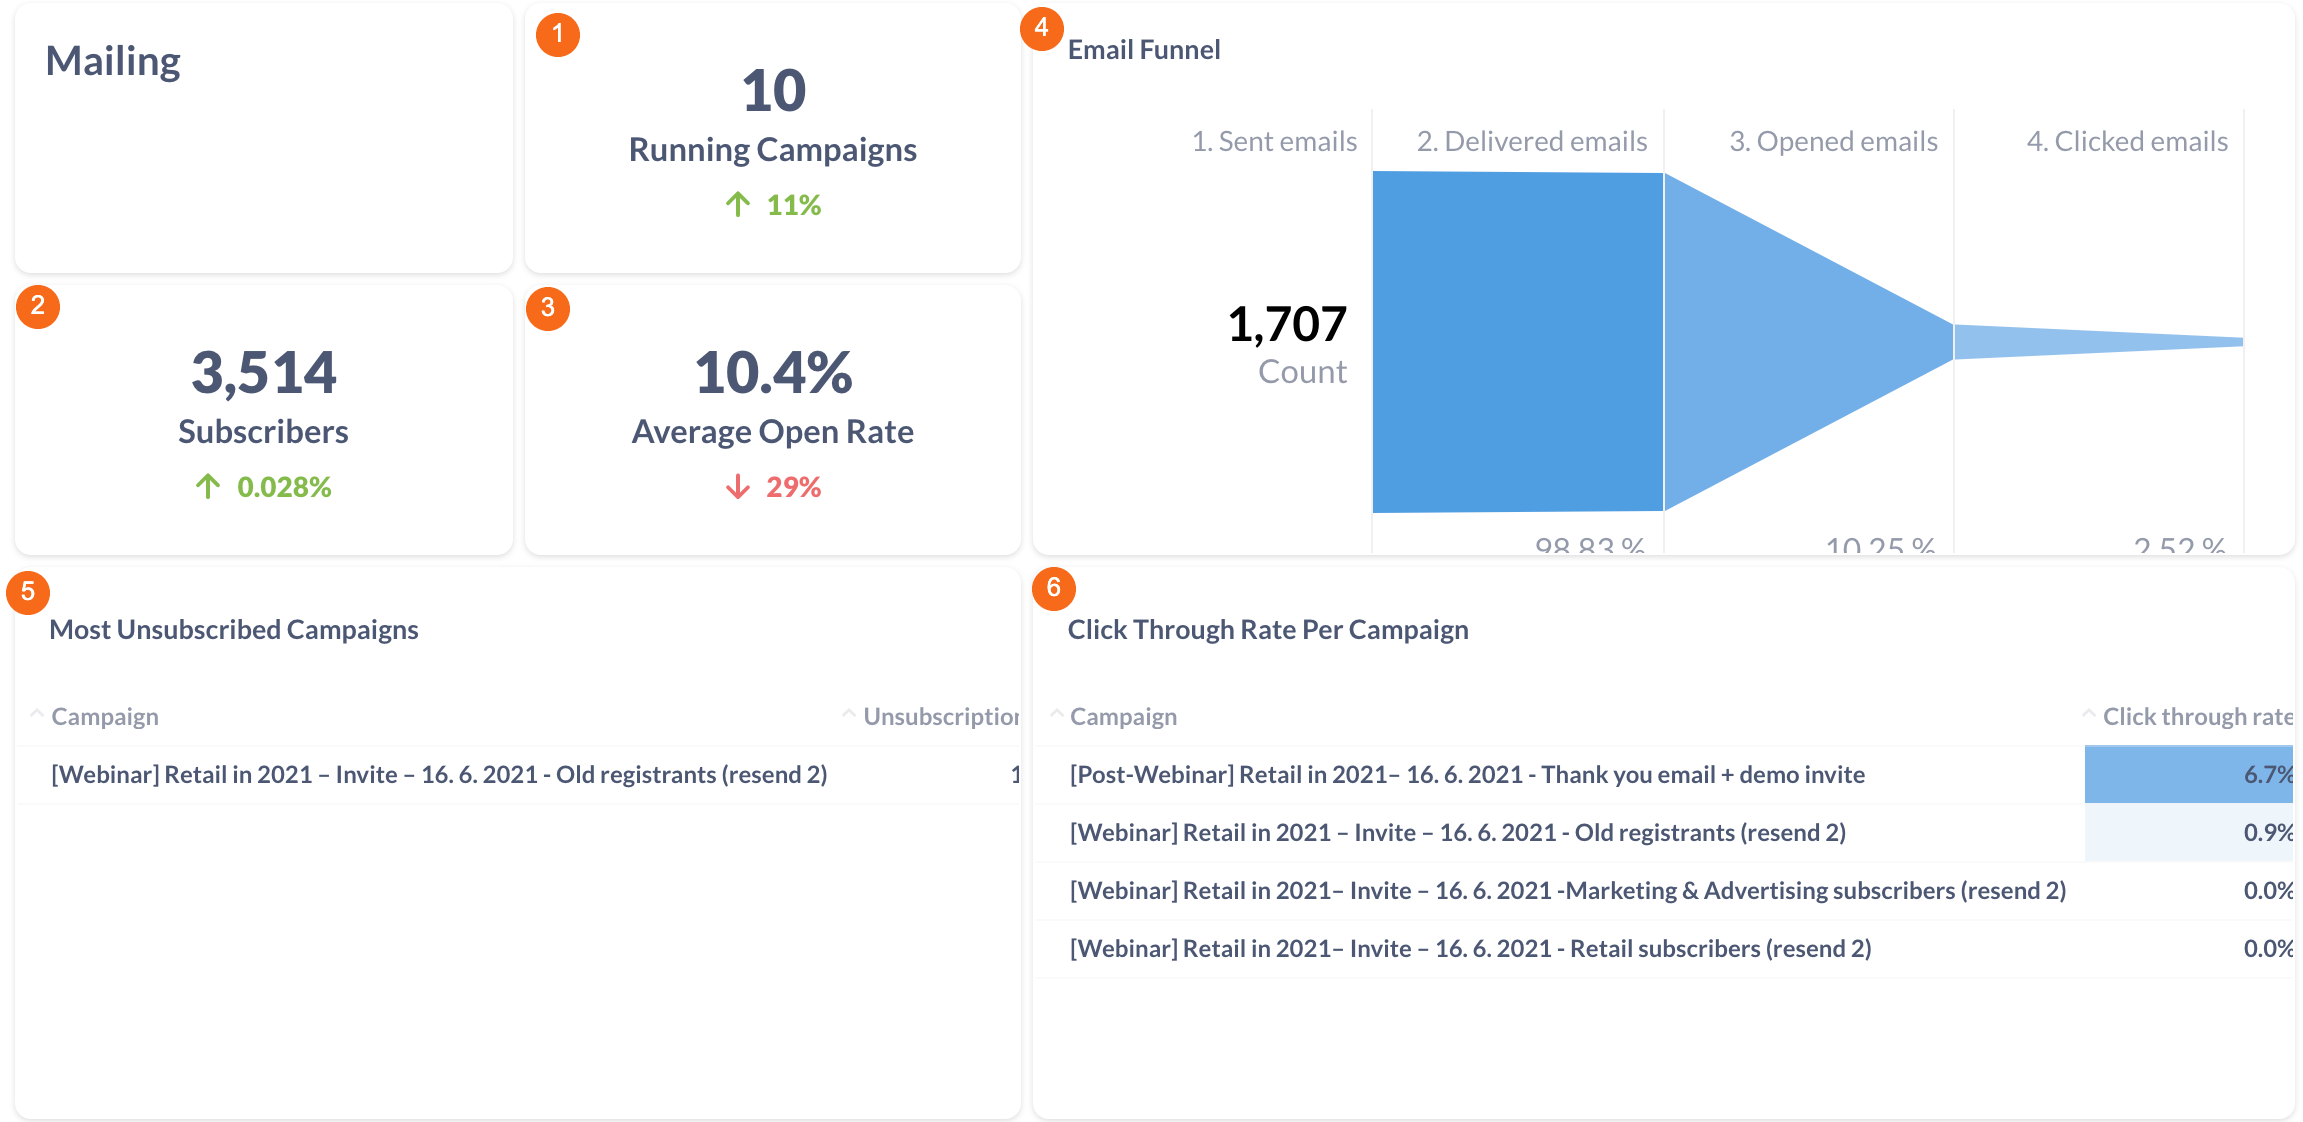
Mailing
|
1. Running campaigns |
Filterable by start date and end
|
|
2. Subscribers |
Filterable by start date and end
|
|
3. Average open rate |
Filterable by start date and end
|
|
4. Email funnel |
|
|
5. Most unsubscribed campaigns |
Filterable by start date and end |
|
6. Clickthrough rate per campaign |
Filterable by start date and end |
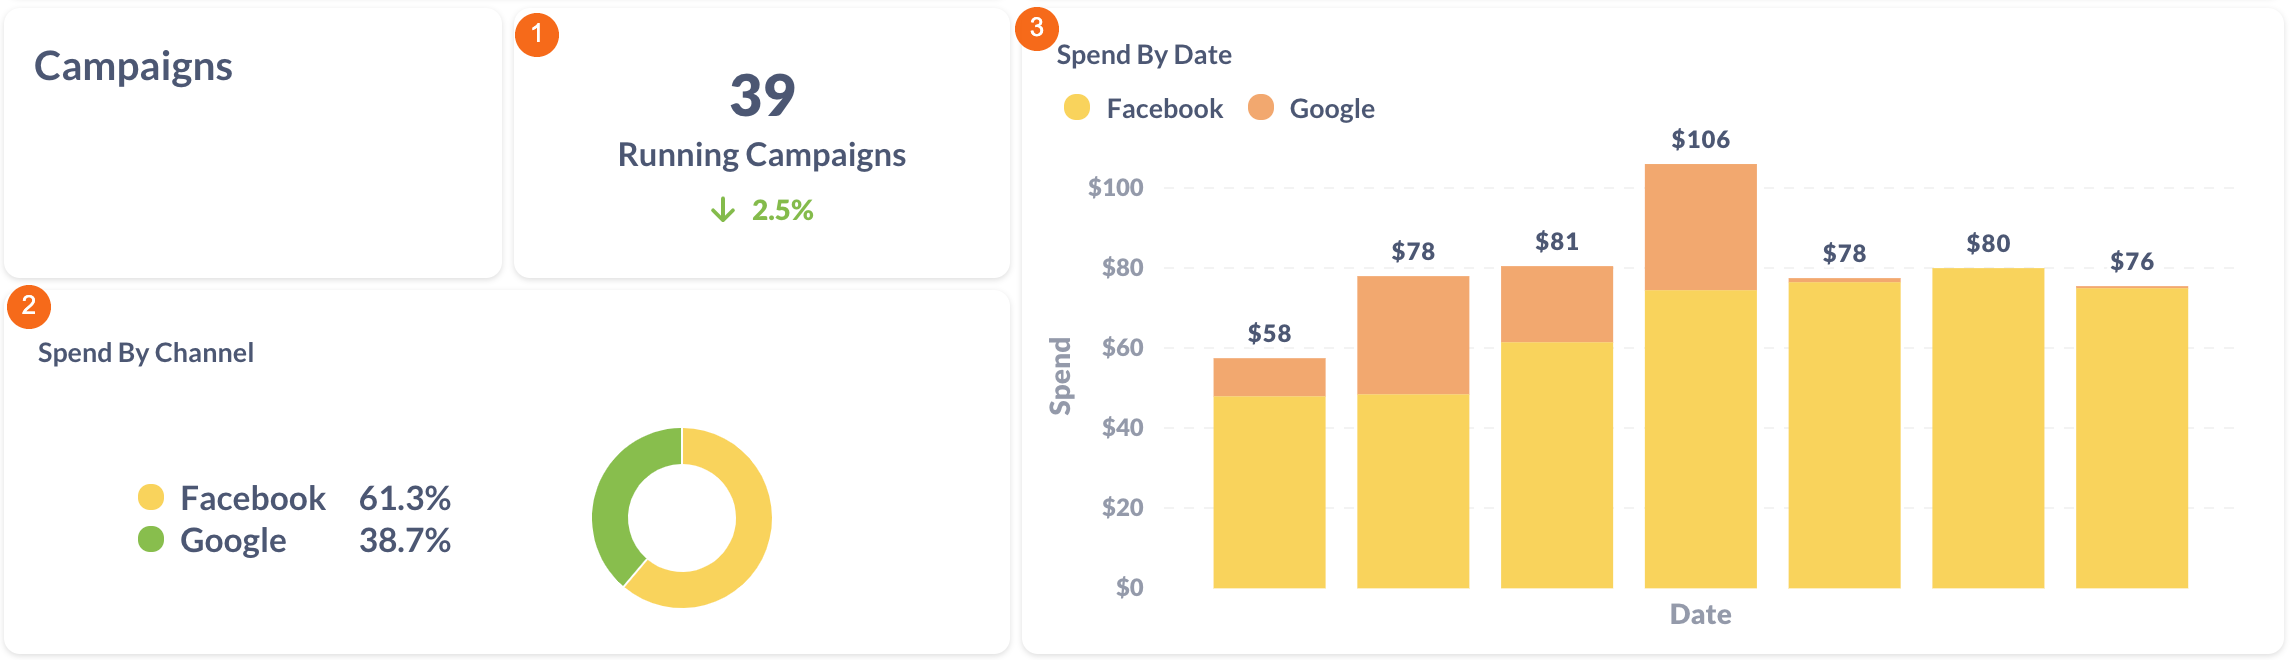
Campaigns
|
1. Running campaigns |
Filterable by start date and end
|
|
2. Spend by channel |
Filterable by start date, end date, campaign |
|
3. Spend by date |
Filterable by start date, end date, campaign |