Tab: Analytics/Funnels
What Funnels are?
Funnels in Meiro are essentiala toolspowerful inanalytical datatool analyticsdesigned forto understandingprovide insights into user behavior and trackingtrack conversion rates toward specific goals. Whether it's completing a purchase, signing up for a newsletter, or filling out a form, funnels allow users to visualize the journey customers take toward these goals.

How Funnels Work
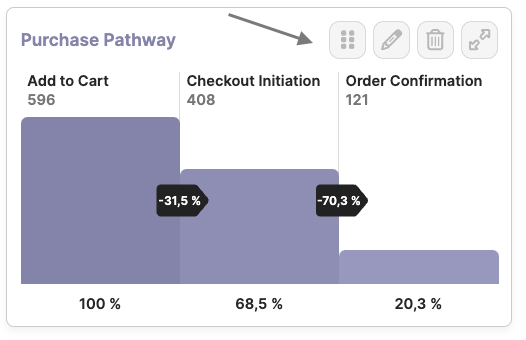
When utilizing the funnel tool, you can easily input the key steps of the customer journey toward a particular goal. The tool then generates a bar chart, with each bar representing the number of customers successfully progressing through each step. This visual representation enables users to identify crucial bottlenecks in the customer journey. While a decrease in conversion rates along the journey is normal, unusual drops may indicate issues at specific touchpoints. Analyzing a Funnel Conversion Trend can enable you to further investigate and pinpoint changes in the website or customer journey that impact conversion rates.
Illustrating theirFunnel coreUsage
Consider a scenario where you want to track the journey of a customer towards completing a purchase. Each step, from viewing an item to finalizing the purchase, presents potential obstacles that may deter customers. By analyzing the drop-offs in successful customers at each step, funnels addressallow broaderyou businessto needspinpoint byareas fosteringfor self-service managementimprovement and democratizingenhance analytics.the Theyoverall empowercustomer businesses to manage and optimize processes independently, reducing reliance on external support. Additionally, incorporating funnels into analytics makes valuable insights accessible to users across departments, fostering a data-driven culture and supporting informed decision-making.experience.
Understanding Funnels
A funnel represents a series of steps or stages that users go through on a specific journey, such as signing up for a service or making a purchase. Each step in the funnel narrows down the number of users as they progress toward the final conversion goal. The funnel structure inherently narrows down the user pool at each stage, offering a granular view of user engagement and progression.
In this article, we will explore the advanced features and functionalities available for both funnel groups and funnels.
FunnelCreate listFunnel/Line chart
Additionally, two control elements are available:Segment Picker: Allows selection of a segment for calculating funnels based on the profiles of the chosen segment instead of the entire Customer Data Platform (CDP) audience. Remember: Lookalike segments are not supported in funnels.Date Picker: Enables the selection of date ranges for funnel calculations. By default, it is set to the last 28 days.
Funnel CreationUsers holding edit access to the selected funnel group can create new chartscharts.
Click the ‘Create chart’ button and select the type of chart you want to create.
Fill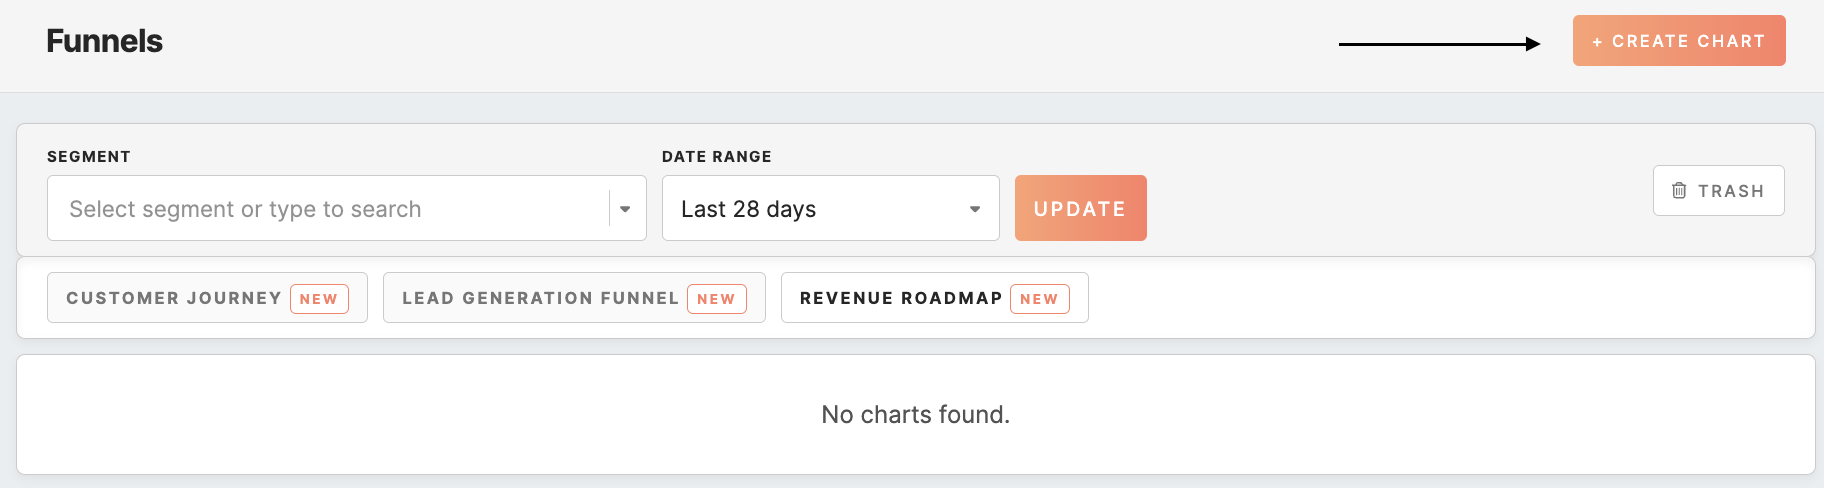
Chart Types
The chart option contains two different types:
- Funnel chart
The funnel chart type offers insights into the progression of values across selected dimensions of the attributes. It visualizes the diminishing number of users as they move through the specified steps or stages of a process. - Line Chart
The line chart provides a view of users' behavior by showcasing the changes in value across the selected dimensions of the single attribute over time. For example, it can illustrate the progression of users adding products to their cart, indicating their shopping intent chronologically.
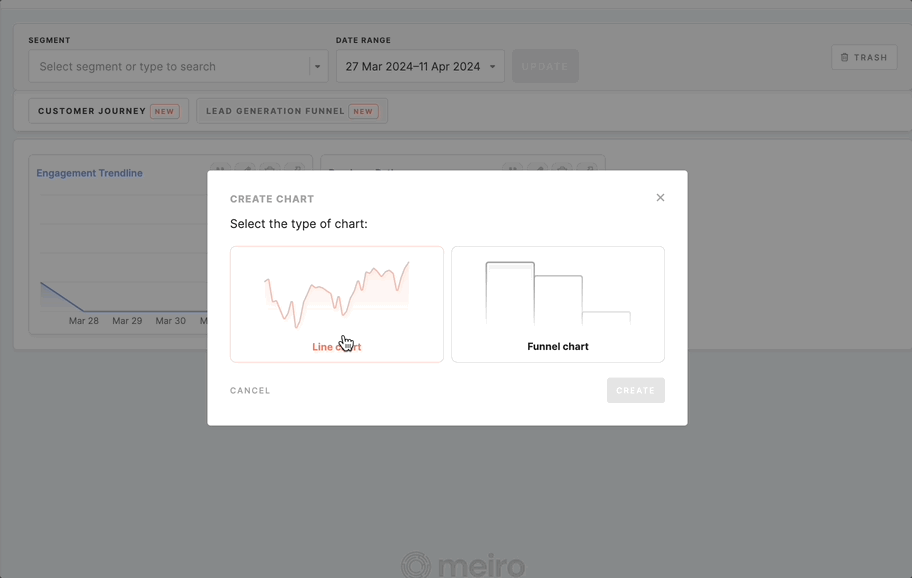
Chart Configurations
Once you have chosen your preferred chart type, fill out the form:

Name(required)
Specify a captivating name forthat succinctly describes the funnel.essence of your chart.
Attributes
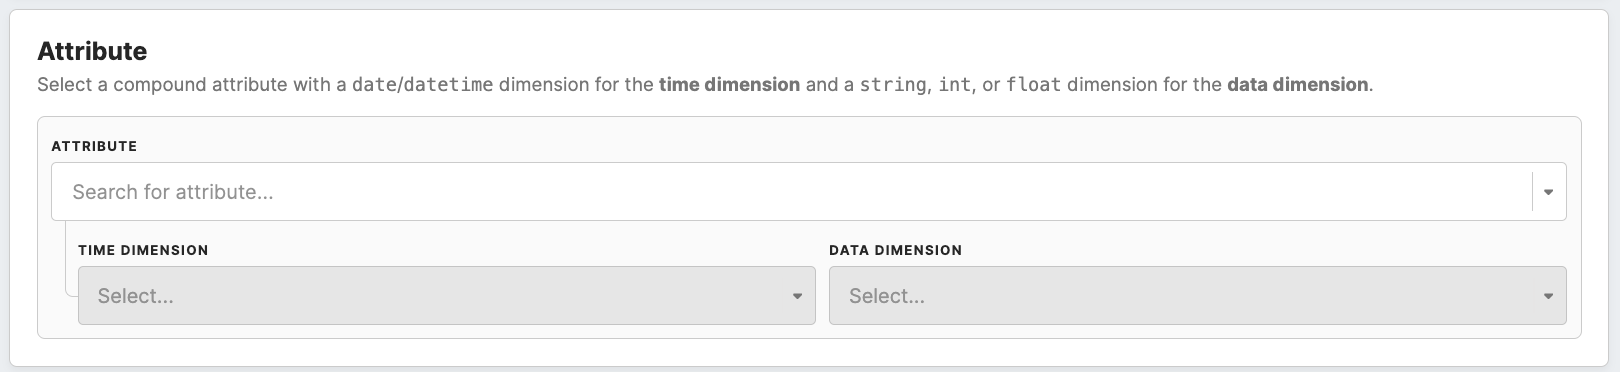
When creating a line chart, you only need to select one compound attribute. TheHowever, chosento attributecreate a funnel chart, you can select up to 10 compound attributes.
Regardless of the chart type, the selected attribute/s must have:meet the specified requirements. These requirements include:
A
- having a dimension with a
dateordatetimetimestamp. This timestamp iscrucialessential for filtering relevant data within selected dateranges,ranges; - attribute
temporalshouldanalysis.Athold at least one additional dimensionholding data inwith theform ofstringor number (integer/float)integer/float) data type. This additional dimension provides the categorical or numerical data necessary for chartvisualizationvisualization.
ForIf you are creating a linefunnel chart, onlysome additional requirements are valid:
- The chosen attribute must possess a dimension with a value of the same data type as the one
compoundselected in the initial step; - You can reuse the same attribute
isinrequired.otherThissteps,attributebutshoulditsfulfilldimensions must differ and maintain theabovesamecriteria,dataenablingtype.
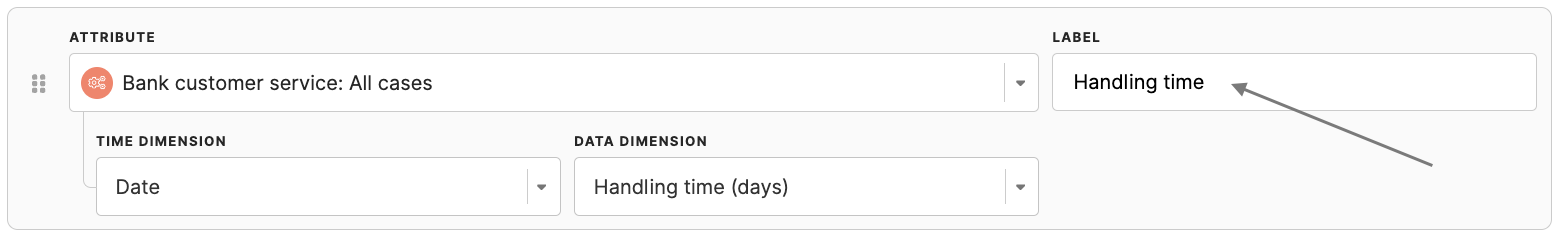
Furthermore, in funnel charts, there is an additional field called "label," where you have the possibility to visualizename temporaleach trendsof orthe patternsadded oversteps. time.Otherwise, a default name will be applied.
Aggregation function

ToAggregation createfunctions are used to summarize and analyze data in a funnelmeaningful chart,way. you can select up to 10 compound attributes. Each attribute should meet the specified requirements, allowing for a comprehensive analysis of user progression through multiple steps or stages.
Read more on the requirements here.Aggregation function (required)
Choose one of the following aggregation functions: sum, count, average, or cardinality.
Remember:Remember: The aggregation function is always selected only once, you cannot create a funnel by having different aggregation functions in different steps.
AggregationLet's functions vary based on data types:For numeric data: Choose from sum, count, or average.For string data: Opt for count or cardinality.
Here'stake a descriptioncloser oflook theat each aggregation functionsfunction availableand forits use within funnel creation:purpose:
Sum:
- Sum: This function calculates the total numerical sum of values within the specified attribute. It's ideal for metrics where cumulative totals matter, such as total revenue, sales, or duration. Sum aggregation provides a comprehensive view of the overall magnitude of a particular metric.
- Count: This function counts the occurrences of each value within the attribute, which is fundamental for quantifying event frequency or instances. Whether tracking user interactions, page visits, or product purchases, count aggregation offers insights into the volume of activities.
- Average: Calculating the mean or average value of numerical data in the attribute, this function provides insights into typical or average metric values. Average order value, session duration, or rating are examples where average aggregation helps understand the central tendency of data.
- Cardinality: By counting the number of distinct values within the attribute, the cardinality function is invaluable for assessing the diversity or uniqueness of categorical data. It's particularly useful for identifying unique users, product categories, or geographic locations.
Count:
Average:
Cardinality:
Remember: The choice of aggregation function depends on the type of data you are working with. For numeric data, you can choose from sum, count, or average. For string data, count or cardinality are the appropriate options.
Color selection
(optional)
Optionally
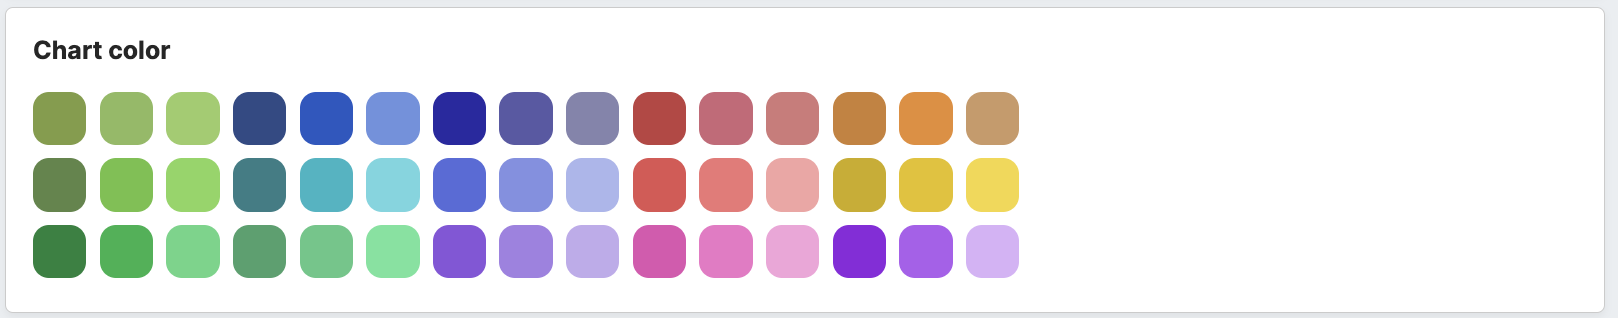
Optionally, you can change the color of a funnel. If you do not pick the color, the primary CDP color is selected by defaultdefault.
Overview of Funnel and Line Charts
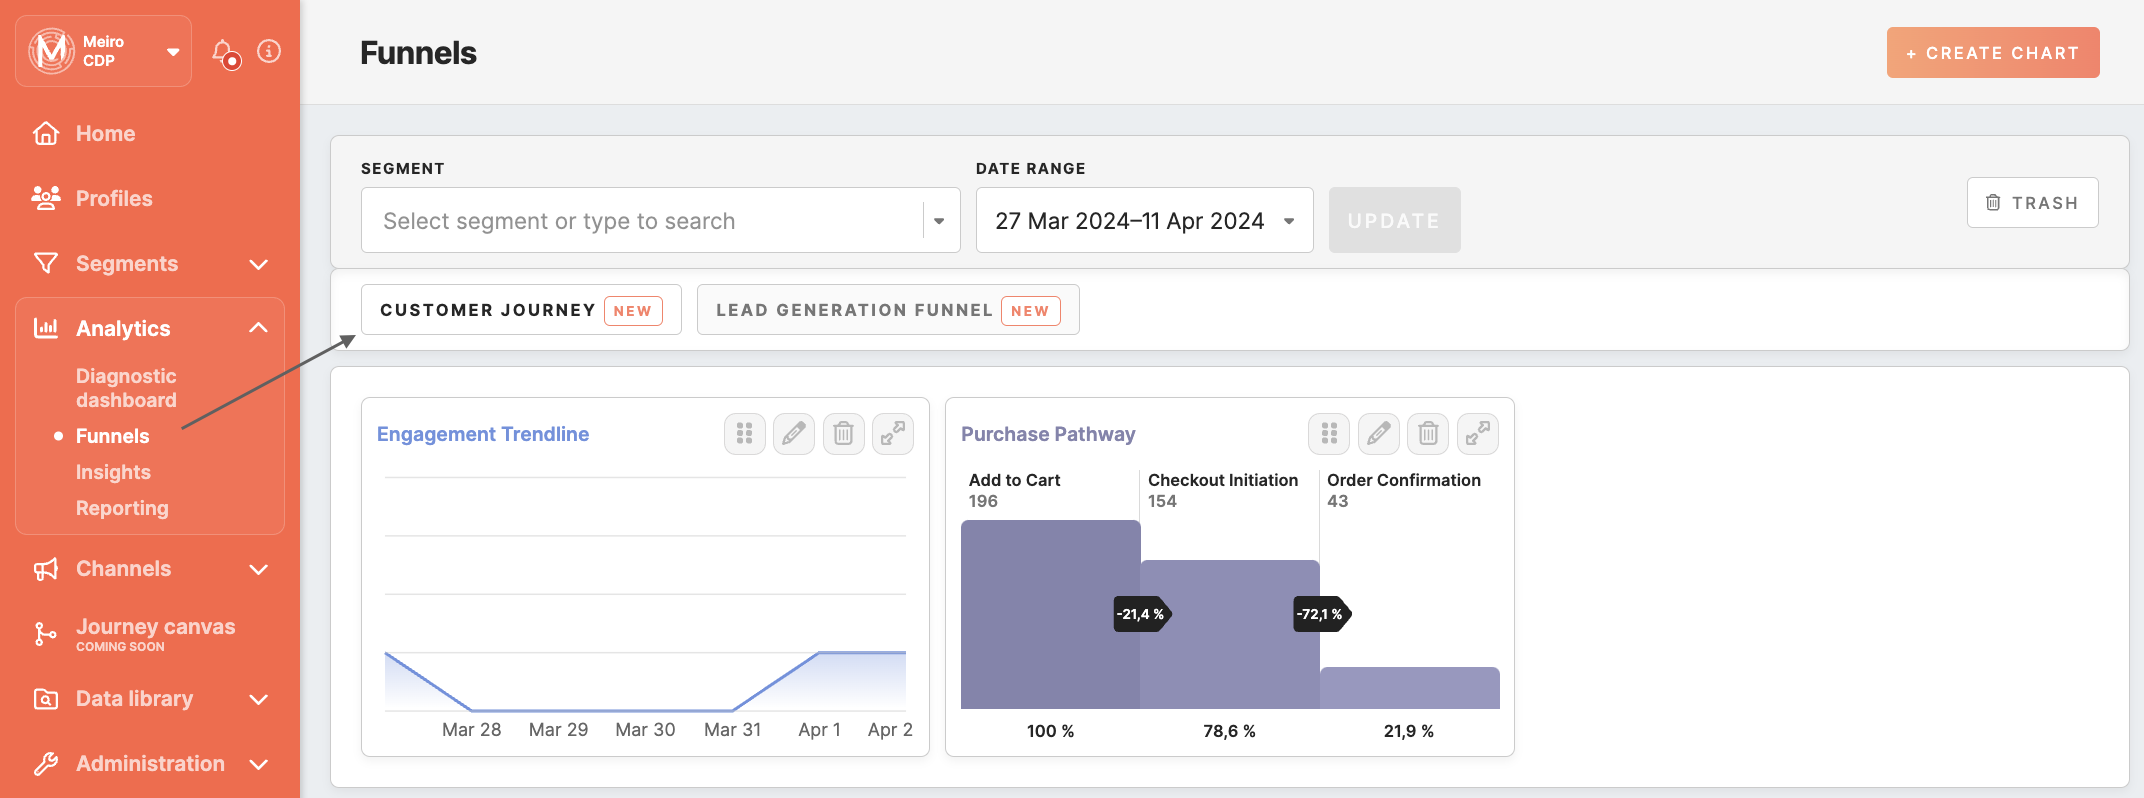
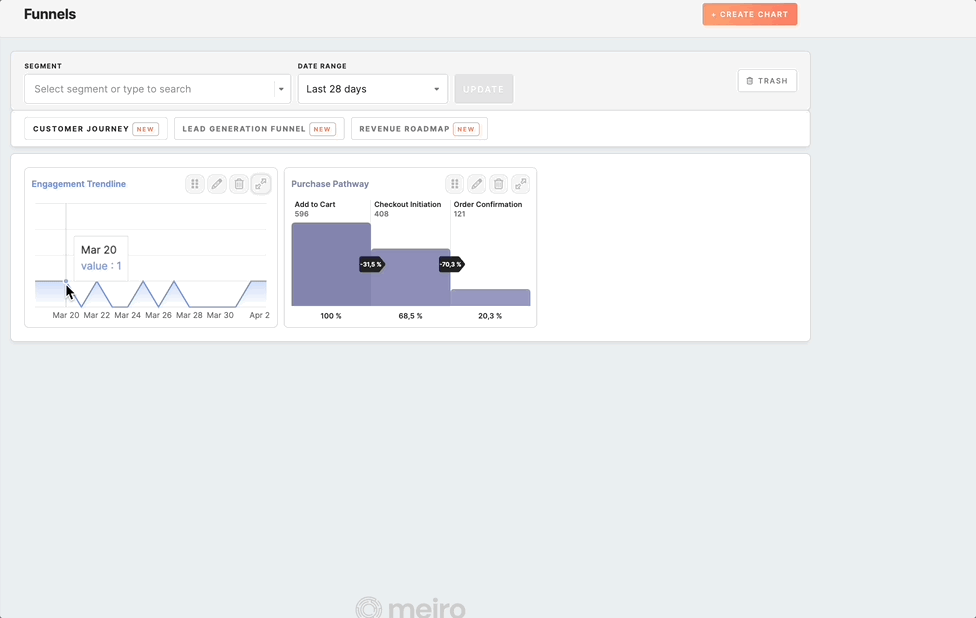
To access the list of funnels, go to the Analytics/Funnels tab.
Creating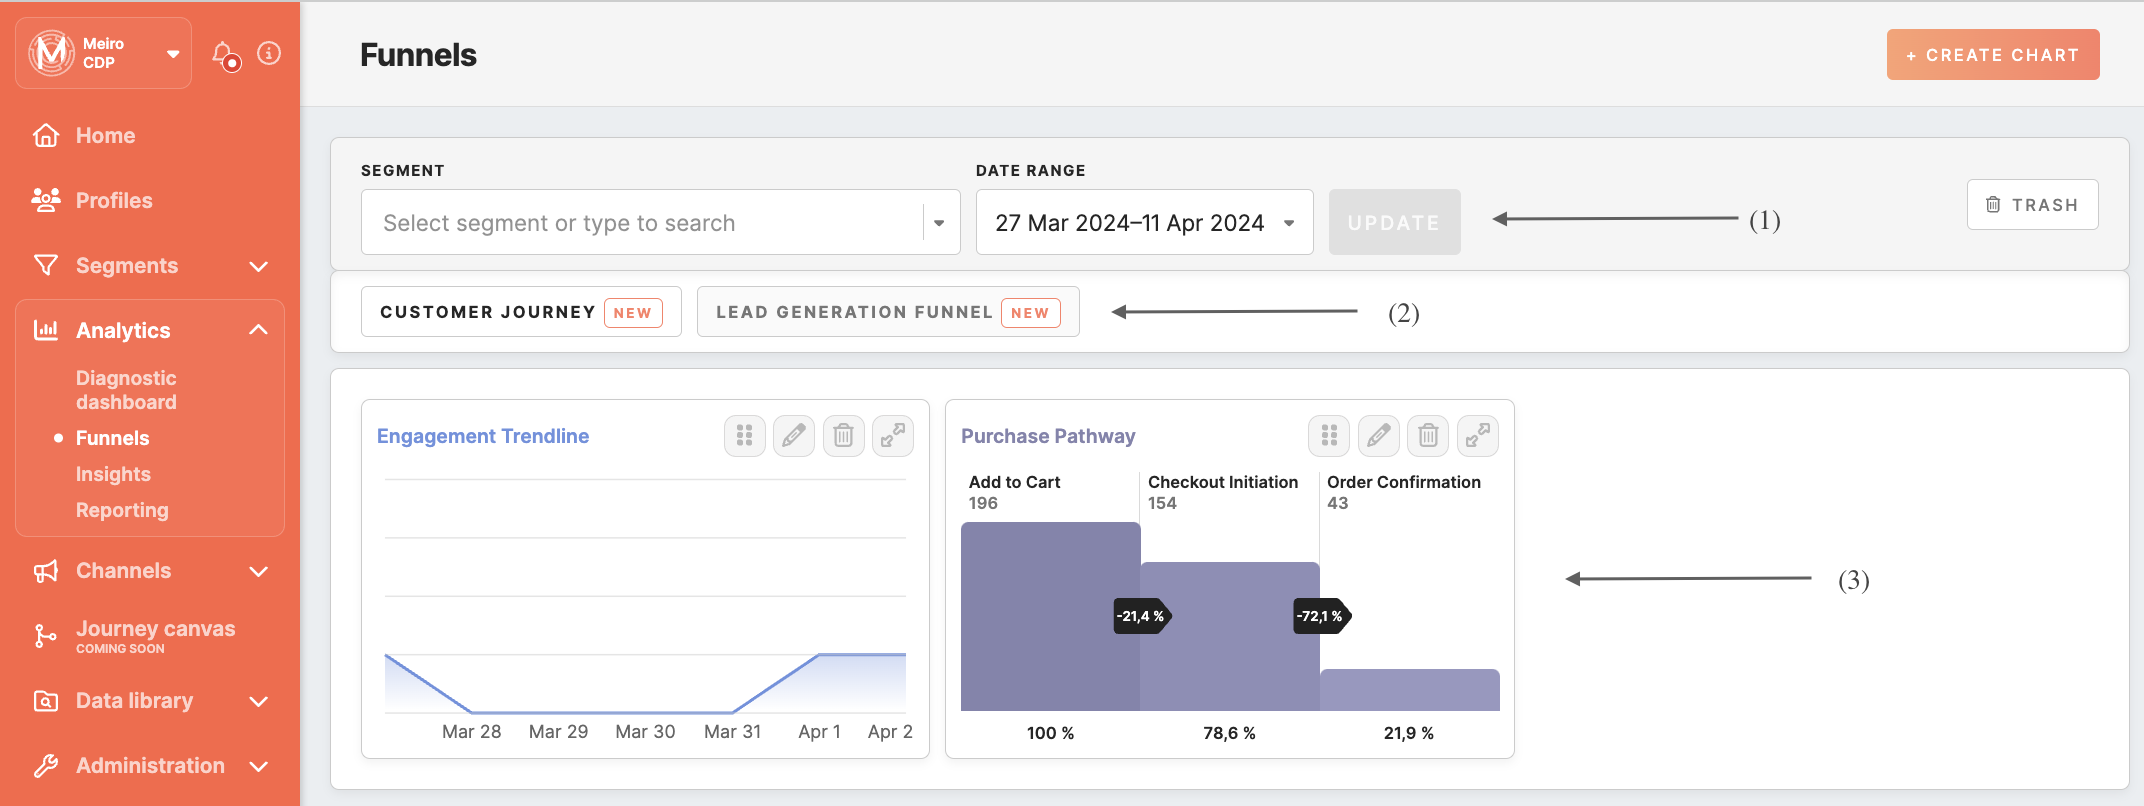
Filtering
You have the flexibility to refine your charts using two filtering options (1). The funnel and line chartcharts Onceshow youanalytics fillfor the entire profile base in allyour CDP unless a filter is applied.
Segment Picker:
Tailor your chart analysis by selecting a specific segment. This feature allows for precise calculations based on the requiredprofiles fieldswithin withthe name,chosen compoundsegment, attribute,providing itsdeeper dimensioninsights withinto timestamp,their its dimension holding data and aggregation function, you’re ready to create line chart . Remember:behavior. Please note that lookalike segments are not supported in funnel analysis.
Date Picker:
Customize your analysis timeframe with the chartdate displayspicker. This option enables you to select specific date ranges whenfor hovering,funnel whereasand line chart calculations, empowering you to analyze trends over different time periods. By default, the profiledate detailpicker pageis provides precise dates for associated cases.Creating funnels To create a funnel chart, you must select up to 10 attributes as separate “steps.”
Each step must adhereset to the followinglast requirements:Each28 attributedays, needsbut you can adjust it according to your specific requirements.
Groups of Funnels
Users who have access to a specific group of funnels will see the corresponding tabs displayed at the top (2). The order of these tabs is determined by the administrator in the Administration/Funnel tab.
You can switch between tabs to view the corresponding line and funnel charts associated with each group.
Funnel list
Users who have a dimensionview withor edit access will see either a timestamp;The chosen attribute must possess a dimension with a valuelist of thefunnels sameor dataline typecharts asbelow. They can expand the onechart selectedto inview themore initialdetails.
Management with Funnels
For users with edit permissions, it is possible to:
Reorder charts: The drag-and-drop functionality allows users to rearrange the order of charts within a group of funnels.
Edit chart settings:settings: Users can modify the attributesconfigurations of existing charts, including name, description, compound attribute, timestamp dimension, data dimension, aggregation function, and color selection.
Delete charts:charts: Users can delete charts they have edit access to. To manage deleted funnels, you can use the "Trash" tab.
Restore charts:charts: To restore a deleted funnel, click on the restore button under the trash tab and select the activegroup groupof funnels to place it.it in.Copy charts: Users can copy charts within the same Funnel Group or into different groups where they also have edit access.Reorder charts: The drag-and-drop functionality allows users to rearrange the order of charts within a Funnel Group. This feature enhances user customization, enabling them to prioritize and showcase charts according to their analytical preferences.
Use casesFunnel analysis emerges as a versatile and powerful tool across diverse business scenarios, offering valuable insights and driving optimizations. Let's explore some practical use cases where funnel analysis proves instrumental in understanding user behavior and ensuring the success of digital experiences:
Evaluating User Journey on a WebsiteScenario:A company is managing a multi-step onboarding process for new users, encompassing a substantial number of steps.Objective: The User Experience (UX) team aims to identify and address any potential challenges or flaws within the user journey.Recognize points where users frequently exit the wizard before completing the account creation.Key Actions:Deploy funnel analysis to pinpoint specific steps in the onboarding process where users commonly experience drop-offs.Examine user engagement at each stage to identify potential areas of improvement in the onboarding journey.Segment users based on their interactions and behaviors to better understand diverse challenges throughout the onboarding process.Specifically, focus on critical steps to gain insights into common user pain points.Offering targeted user assistance via support channels, which could include call centers, chat support, or self-help resources.Iteratively optimizing the onboarding process based on identified challenges to foster a smoother user journey for all users.
By adopting these general key actions, the company can systematically analyze and enhance its onboarding process, fostering a user-centric approach and ensuring a more seamless experience for all new users.
Evaluating Campaign PerformanceScenario:A client aims to evaluate the effectiveness of their marketing campaigns conducted through a journey canvas.Objective:Understand the success of each step in the campaign and make data-driven adjustments for future initiatives.Key Actions:Leverage funnels to analyze and measure the success of individual steps in the marketing campaign.Utilize funnel functionality as a reporting feature, offering insights into user progression throughout the campaign journey.Gain a comprehensive understanding of the campaign's effectiveness, enabling strategic adjustments to improve future initiatives.
Enhancing User Experience in E-CommerceScenario:An e-commerce platform faces challenges with users abandoning the multi-stage checkout process.Objective:Identify bottlenecks, optimize user experience, and monitor the impact of website updates on the checkout flow.Key Actions:Utilize funnels to identify specific stages where users commonly abandon the checkout process.Optimize the user experience to increase conversion rates based on insights derived from funnel analysis.Monitor and assess the impact of website updates on the efficiency of the checkout flow.
Streamlining Subscription Renewal FlowScenario:A subscription-based service undergoes challenges in the renewal process with multiple steps.Objective:Analyze user behavior during the subscription renewal journey, identify drop-off stages, and boost retention.Key Actions:Employ funnel analysis to identify stages where users commonly drop off during the subscription renewal journey.Implement improvements to streamline the renewal process, ensuring a seamless experience for users.Strategically enhance the subscription renewal flow to boost retention rates.Through these key actions, the subscription-based service can systematically enhance the renewal process, addressing pain points and ensuring higher retention rates.FAQWhat is the difference between cardinality and count for string dimensions of the attribute?
The difference between cardinality and count for string dimensions of an attribute lies in how they quantify the data:
Count simply tallies the number of occurrences of each value within the specified string dimension. It provides a straightforward measure of frequency.Cardinality, on the other hand, counts the number of distinct or unique values within the string dimension. It offers insights into the diversity or uniqueness of values within the dataset.
For example, consider a scenario where you're analyzing the current status of cases in a dataset:
Using count, you would get the total number of times each status appears. If there are two occurrences of the "closed" status and on, their count would be two.With cardinality, you would determine the total number of unique status values present. In this case, if there's only one unique status value, which is "closed," the cardinality would be one.