Tab: Analytics/Funnels
What Funnels are?
Funnels are essential tools in data analytics for understanding user behavior and tracking conversion rates. Beyond their core functionality, funnels address broader business needs by fostering self-service management and democratizing analytics. They empower businesses to manage and optimize processes independently, reducing reliance on external support. Additionally, incorporating funnels into analytics makes valuable insights accessible to users across departments, fostering a data-driven culture and supporting informed decision-making.
Understanding Funnels
A funnel represents a series of steps or stages that users go through on a specific journey, such as signing up for a service or making a purchase. Each step in the funnel narrows down the number of users as they progress toward the final conversion goal. The funnel structure inherently narrows down the user pool at each stage, offering a granular view of user engagement and progression.
In this article, we will explore the advanced features and functionalities available for both funnel groups and funnels.
Funnel list
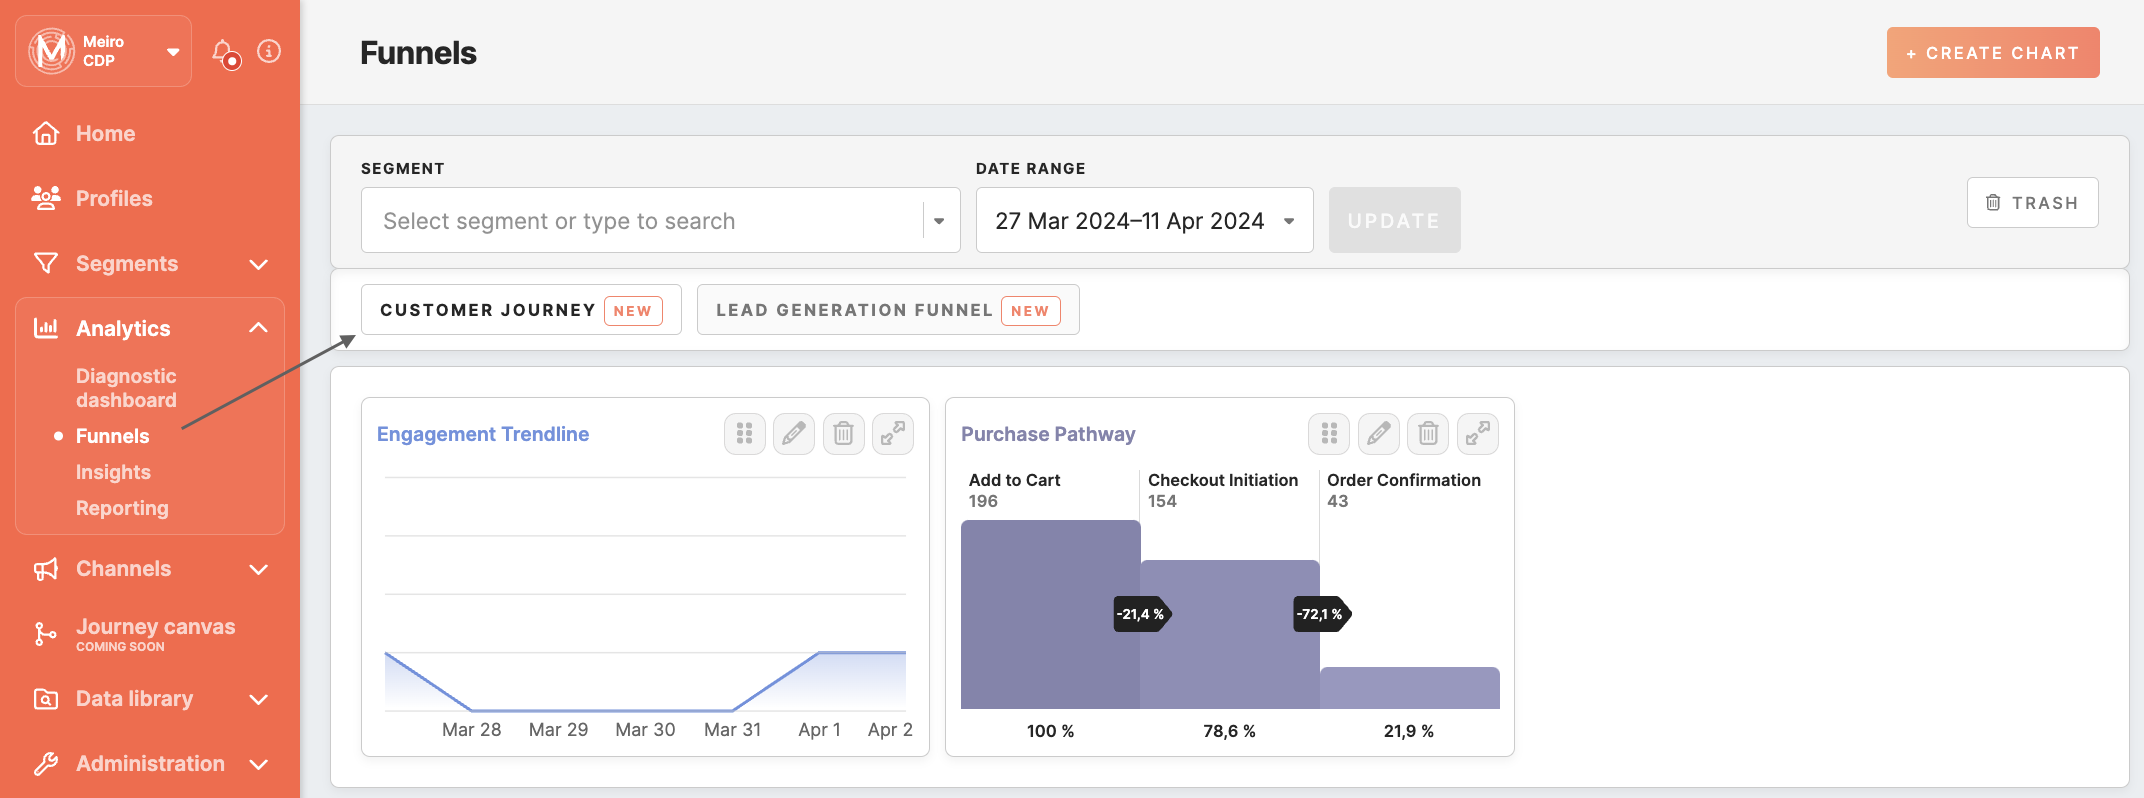
Go to the Analytics/Funnels tab to see the list of funnel groups. Users with access to specific Funnel Groups will see the corresponding tabs displayed in the order specified by the administrator in the Administration/Configuration/Funnel tab.
Additionally, two control elements are available:
Segment Picker: Allows selection of a segment for calculating funnels based on the profiles of the chosen segment instead of the entire Customer Data Platform (CDP) audience.
Remember: Lookalike segments are not supported in funnels.
Date Picker: Enables the selection of date ranges for funnel calculations. By default, it is set to the last 28 days.
Funnel Creation
Users holding edit access to the selected funnel group can create new charts inside the group.
Click the ‘Create chart’ button and select the type of chart you want to create.
Fill out the form:
Name
(required)
Specify a name for the funnel.
Description
(optional)
A description or additional details about the funnel.
Compound attribute
(required)
Select a compound attribute. The chosen attribute must have:
A dimension with a date or datetime timestamp. This timestamp is crucial for filtering relevant data within selected date ranges, enabling temporal analysis.
At least one additional dimension holding data in the form of string or number (integer/float) data type. This additional dimension provides the categorical or numerical data necessary for chart visualization and analysis.
For creating a line chart, only one compound attribute is required. This attribute should fulfill the above criteria, enabling you to visualize temporal trends or patterns over time.
To create a funnel chart, you can select up to 10 compound attributes. Each attribute should meet the specified requirements, allowing for a comprehensive analysis of user progression through multiple steps or stages.
Read more on the requirements here.
Aggregation function (required)
Choose one of the following aggregation functions: sum, count, average, or cardinality.
Remember: The aggregation function is always selected only once, you cannot create a funnel by having different aggregation functions in different steps.
Aggregation functions vary based on data types:
For numeric data: Choose from sum, count, or average.
For string data: Opt for count or cardinality.
Here's a description of the aggregation functions available for use within funnel creation:
Sum: This function calculates the total numerical sum of values within the specified attribute. It's ideal for metrics where cumulative totals matter, such as total revenue, sales, or duration. Sum aggregation provides a comprehensive view of the overall magnitude of a particular metric.
Count: This function counts the occurrences of each value within the attribute, which is fundamental for quantifying event frequency or instances. Whether tracking user interactions, page visits, or product purchases, count aggregation offers insights into the volume of activities.
Average: Calculating the mean or average value of numerical data in the attribute, this function provides insights into typical or average metric values. Average order value, session duration, or rating are examples where average aggregation helps understand the central tendency of data.
Cardinality: By counting the number of distinct values within the attribute, the cardinality function is invaluable for assessing the diversity or uniqueness of categorical data. It's particularly useful for identifying unique users, product categories, or geographic locations.
Color selection
(optional)
Optionally you can change the color of a funnel. If you do not pick the color, the primary CDP color is selected by default
Creating line chart
Once you fill in all the required fields with name, compound attribute, its dimension with timestamp, its dimension holding data and aggregation function, you’re ready to create line chart .
Remember: Please note that the chart displays date ranges when hovering, whereas the profile detail page provides precise dates for associated cases.
Creating funnels
To create a funnel chart, you must select up to 10 attributes as separate “steps.”
Each step must adhere to the following requirements:
Each attribute needs to have a dimension with a timestamp;
The chosen attribute must possess a dimension with a value of the same data type as the one selected in the initial step;
You can reuse the same attribute in other steps, but its dimensions must differ and maintain the same data type.
Management with Funnels
For users with edit permissions, it is possible to:
Edit chart settings: Users can modify the attributes of existing charts, including name, description, compound attribute, timestamp dimension, data dimension, aggregation function, and color selection.
Delete charts: Users can delete charts they have edit access to. To manage deleted funnels, you can use the "Trash" tab.
Restore charts: To restore a deleted funnel, click on the restore button under the trash tab and select the active group to place it.
Copy charts: Users can copy charts within the same Funnel Group or into different groups where they also have edit access.
Reorder charts: The drag-and-drop functionality allows users to rearrange the order of charts within a Funnel Group. This feature enhances user customization, enabling them to prioritize and showcase charts according to their analytical preferences.
Use cases
Funnel analysis emerges as a versatile and powerful tool across diverse business scenarios, offering valuable insights and driving optimizations. Let's explore some practical use cases where funnel analysis proves instrumental in understanding user behavior and ensuring the success of digital experiences:
Evaluating User Journey on a Website
Scenario:
A company is managing a multi-step onboarding process for new users, encompassing a substantial number of steps.
Objective:
The User Experience (UX) team aims to identify and address any potential challenges or flaws within the user journey.
Recognize points where users frequently exit the wizard before completing the account creation.
Key Actions:
Deploy funnel analysis to pinpoint specific steps in the onboarding process where users commonly experience drop-offs.
Examine user engagement at each stage to identify potential areas of improvement in the onboarding journey.
Segment users based on their interactions and behaviors to better understand diverse challenges throughout the onboarding process.
Specifically, focus on critical steps to gain insights into common user pain points.
Offering targeted user assistance via support channels, which could include call centers, chat support, or self-help resources.
Iteratively optimizing the onboarding process based on identified challenges to foster a smoother user journey for all users.
By adopting these general key actions, the company can systematically analyze and enhance its onboarding process, fostering a user-centric approach and ensuring a more seamless experience for all new users.
Evaluating Campaign Performance
Scenario:
A client aims to evaluate the effectiveness of their marketing campaigns conducted through a journey canvas.
Objective:
Understand the success of each step in the campaign and make data-driven adjustments for future initiatives.
Key Actions:
Leverage funnels to analyze and measure the success of individual steps in the marketing campaign.
Utilize funnel functionality as a reporting feature, offering insights into user progression throughout the campaign journey.
Gain a comprehensive understanding of the campaign's effectiveness, enabling strategic adjustments to improve future initiatives.
Enhancing User Experience in E-Commerce
Scenario:
An e-commerce platform faces challenges with users abandoning the multi-stage checkout process.
Objective:
Identify bottlenecks, optimize user experience, and monitor the impact of website updates on the checkout flow.
Key Actions:
Utilize funnels to identify specific stages where users commonly abandon the checkout process.
Optimize the user experience to increase conversion rates based on insights derived from funnel analysis.
Monitor and assess the impact of website updates on the efficiency of the checkout flow.
Streamlining Subscription Renewal Flow
Scenario:
A subscription-based service undergoes challenges in the renewal process with multiple steps.
Objective:
Analyze user behavior during the subscription renewal journey, identify drop-off stages, and boost retention.
Key Actions:
Employ funnel analysis to identify stages where users commonly drop off during the subscription renewal journey.
Implement improvements to streamline the renewal process, ensuring a seamless experience for users.
Strategically enhance the subscription renewal flow to boost retention rates.
Through these key actions, the subscription-based service can systematically enhance the renewal process, addressing pain points and ensuring higher retention rates.
FAQ
What is the difference between cardinality and count for string dimensions of the attribute?
The difference between cardinality and count for string dimensions of an attribute lies in how they quantify the data:
Count simply tallies the number of occurrences of each value within the specified string dimension. It provides a straightforward measure of frequency.
Cardinality, on the other hand, counts the number of distinct or unique values within the string dimension. It offers insights into the diversity or uniqueness of values within the dataset.
For example, consider a scenario where you're analyzing the current status of cases in a dataset:
Using count, you would get the total number of times each status appears. If there are two occurrences of the "closed" status and on, their count would be two.
With cardinality, you would determine the total number of unique status values present. In this case, if there's only one unique status value, which is "closed," the cardinality would be one.