Diagnostic Dashboard
The Diagnostic Dashboard displays information about the data of your available customer profiles.
Remember: allAll data on the Diagnostic Dashboard (except customer event statistics) will be recalculated onduring the latest refresh. ViewThe refresh timing may result in the top right corner when data was updated at the latest. Due to this reason if the update was done in a different period you may noticetemporary differences between the data presentedshown in the Diagnostic Dashboardhere and other parts of the product thatparts, aresuch calculated instantly e.g.,as segment calculationcalculations or profile search.searches, which update instantly.
| The number of profiles | The total number of profiles. Browsing through all customer profiles is possible in the Profiles tab. |
| Connected sources | The number of all the data sources connected. All connected sources are listed in the Data Library/ Sources tab |
| Profiles attributes | The total number of profiles all attributes. All attributes are listed in the Data Library/ Attributes tab. |
| Total events | The total number of events for all customer profiles, including the hidden ones. All visible and hidden events are listed under Admin/Entities/Events tab. |
| Data updated |
How long ago has the dashboard been updated Remember: Customer event statistics may not be immediately visible on the diagnostic dashboard due to the caching mechanism. The dashboard is refreshed at a different interval than other data sources, leading to potential delays in displaying events. to the Data Updated box. |
License usage will be visible only to users that are granted access in their user role.
|
Monthly processed events (last 30 days) |
Total events processed in the last 30 days. |
|
Total events stored (as of now) |
Total events in storage, including hidden events. |
|
Total number of unified profiles |
Total number of unified profiles after identity stitching. |
| New events over time(1) |
Stacked chart with the number of events collected. Watch out for extreme dips or spikes as they might indicate irregularity in the data. Resolution for charts is auto-calculated in: days - if the events activity <= 60 days weeks - if the events activity <= 60 * 7 days months - otherwise (events activity > 60 * 7 days) |
| Number of identified profiles over time (2) |
The number of identified profiles across the time. Watch out for extreme dips or spikes as they might indicate irregularity in the data and/or customer profiles' identification process. Resolution for charts is auto-calculated in: days - if the profiles identified <= 60 days weeks - if the profiles identified <= 60 * 7 days months - otherwise (events activity > 60 * 7 days) |
| The number of unique profiles identified across x sources(1) | The number of profiles identified through x sources. The maximum of x is the total number of data sources. The higher the number of identified profiles across data sources, the better the performance of the customer profiling process and the better the quality of the customer profile output. |
| The number of profiles identified per source(2) | This profile shows the number of identified customer profiles per data source. |
|
Profiles' attributes updated (1) |
This chart shows if the profiles' attributes are kept up to date. Immediate updates happen each time a new event arrives. Also, when a customer profile entity merges with another entity. Depending on the instance, full entities refresh happens from 1 - 7 days. |
|
Suspicious profiles (2) |
This chart shows the list of top 10 profile entities with a suspiciously large number of events (>= 10000). By clicking on the customer profile ID, the user will be redirected to the customer’s profile page. |
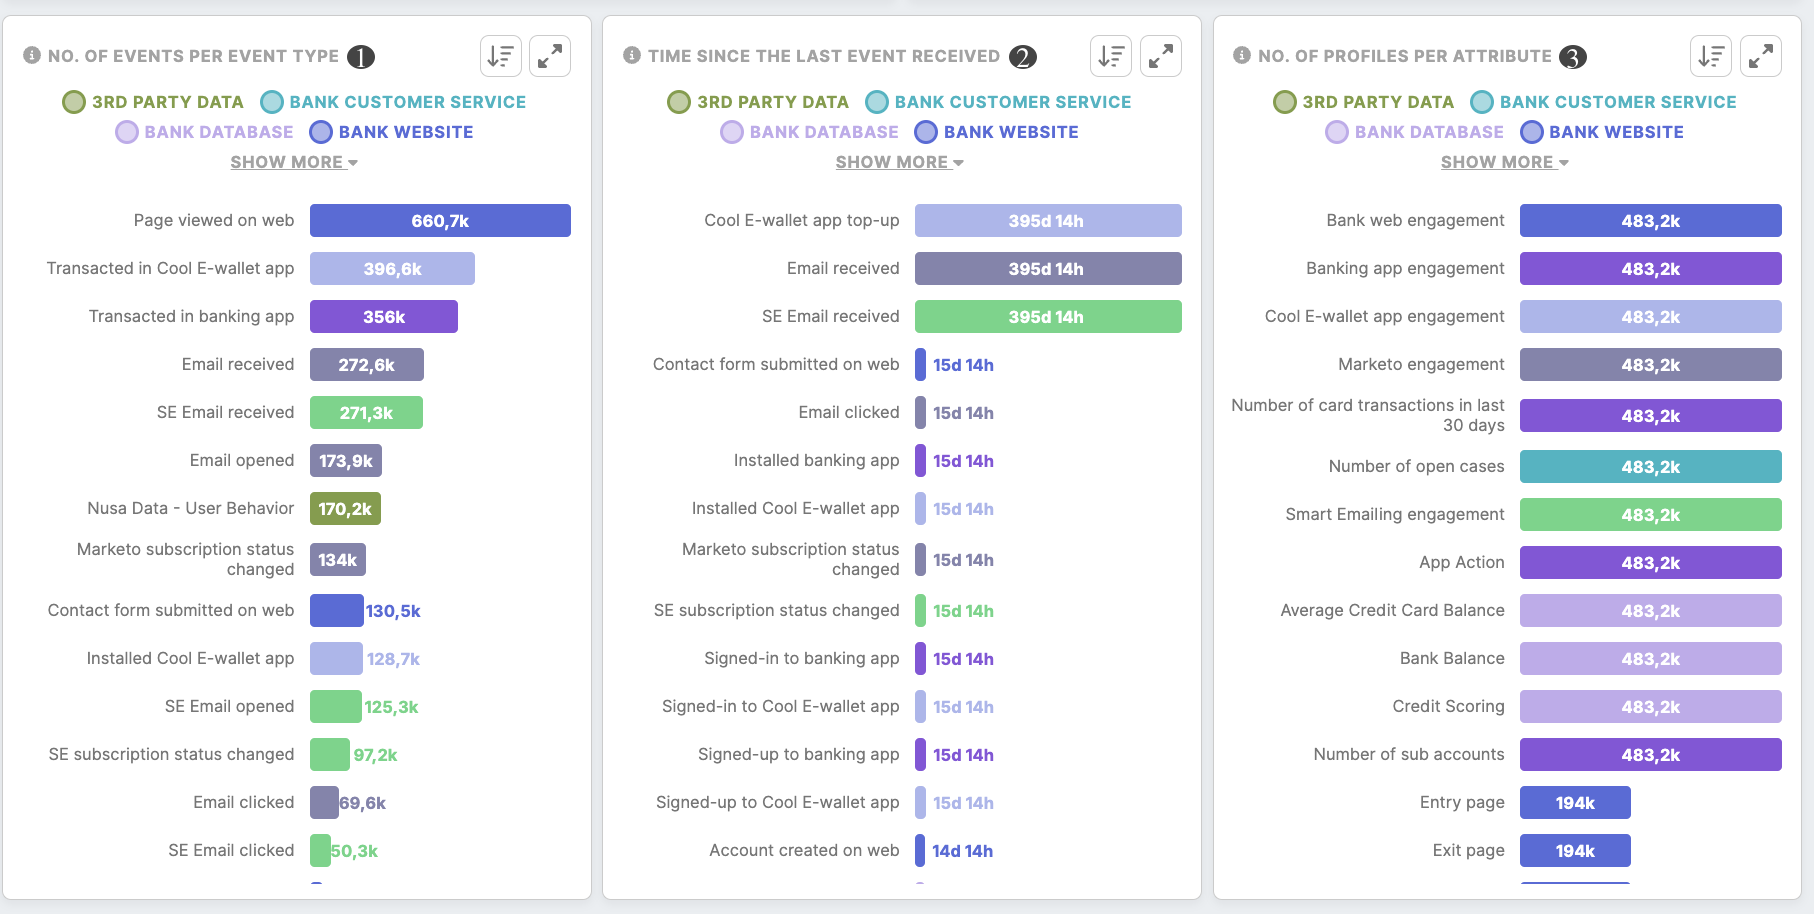
| The number of events per event type(1) | Customer engagement across different types of events captured in your project. Check out which channels and/or activities your customer engages with the most. |
| The time since the last event received(2) | The elapsed time since the last event of each event type. Events are usually collected daily. If the event data reception time is exceeded, it may indicate that your data is not collected frequently enough. In some cases, this may indicate that there are no new events available (for example, there have not been transactions made for that particular day). |
| The number of profiles per attribute(3) |
The number of identified profiles by each attribute in your projects.
Remember: Not all attribute values necessarily originate from event data. Certain attributes can have values independent of an event for a given source. This can lead to an apparent inconsistency when comparing “The number of profiles identified per source(2)” since some attributes may exist even without corresponding events. |


